
Trends
Kosciusko County, Indiana Farm Sells for $20,000 an Acre
Kosciusko County farm sells for $20,000 an acre, highlighting strong demand for high-quality farmland in Indiana.
Acres Farmland Value Index tracks Midwest land trends from 2018-2024, providing insights into market performance based on actual transaction data.
Unlike traditional indices that rely on survey responses or aggregated estimates, the Acres Farmland Value Index is built from observed land transaction data. The index focuses on farmland across Iowa, Indiana, Illinois, Minnesota, Missouri, Nebraska, Ohio, and Wisconsin using transaction-level details to calculate values.
This methodology offers a dynamic view of the market. Key inputs include:
The Acres Farmland Value Index provides an actionable, up-to-date benchmark that empowers landowners, buyers, and analysts to make smarter decisions.
A farmland value index benchmarks land values over time relative to a specific baseline period. By aggregating observed land transactions across a region—such as a state or multi-state area—the index tracks how land values shift over time to offer a consistent lens through which to view long-term market trends.
Indices smooth out temporary price swings and instead focus on revealing longer-term shifts in land values. This is especially useful for financial modeling, making investment decisions, and understanding local market health. While national trends affect values, regional nuances—such as crop type, soil quality, and local economic drivers—play a key role in shaping the index.
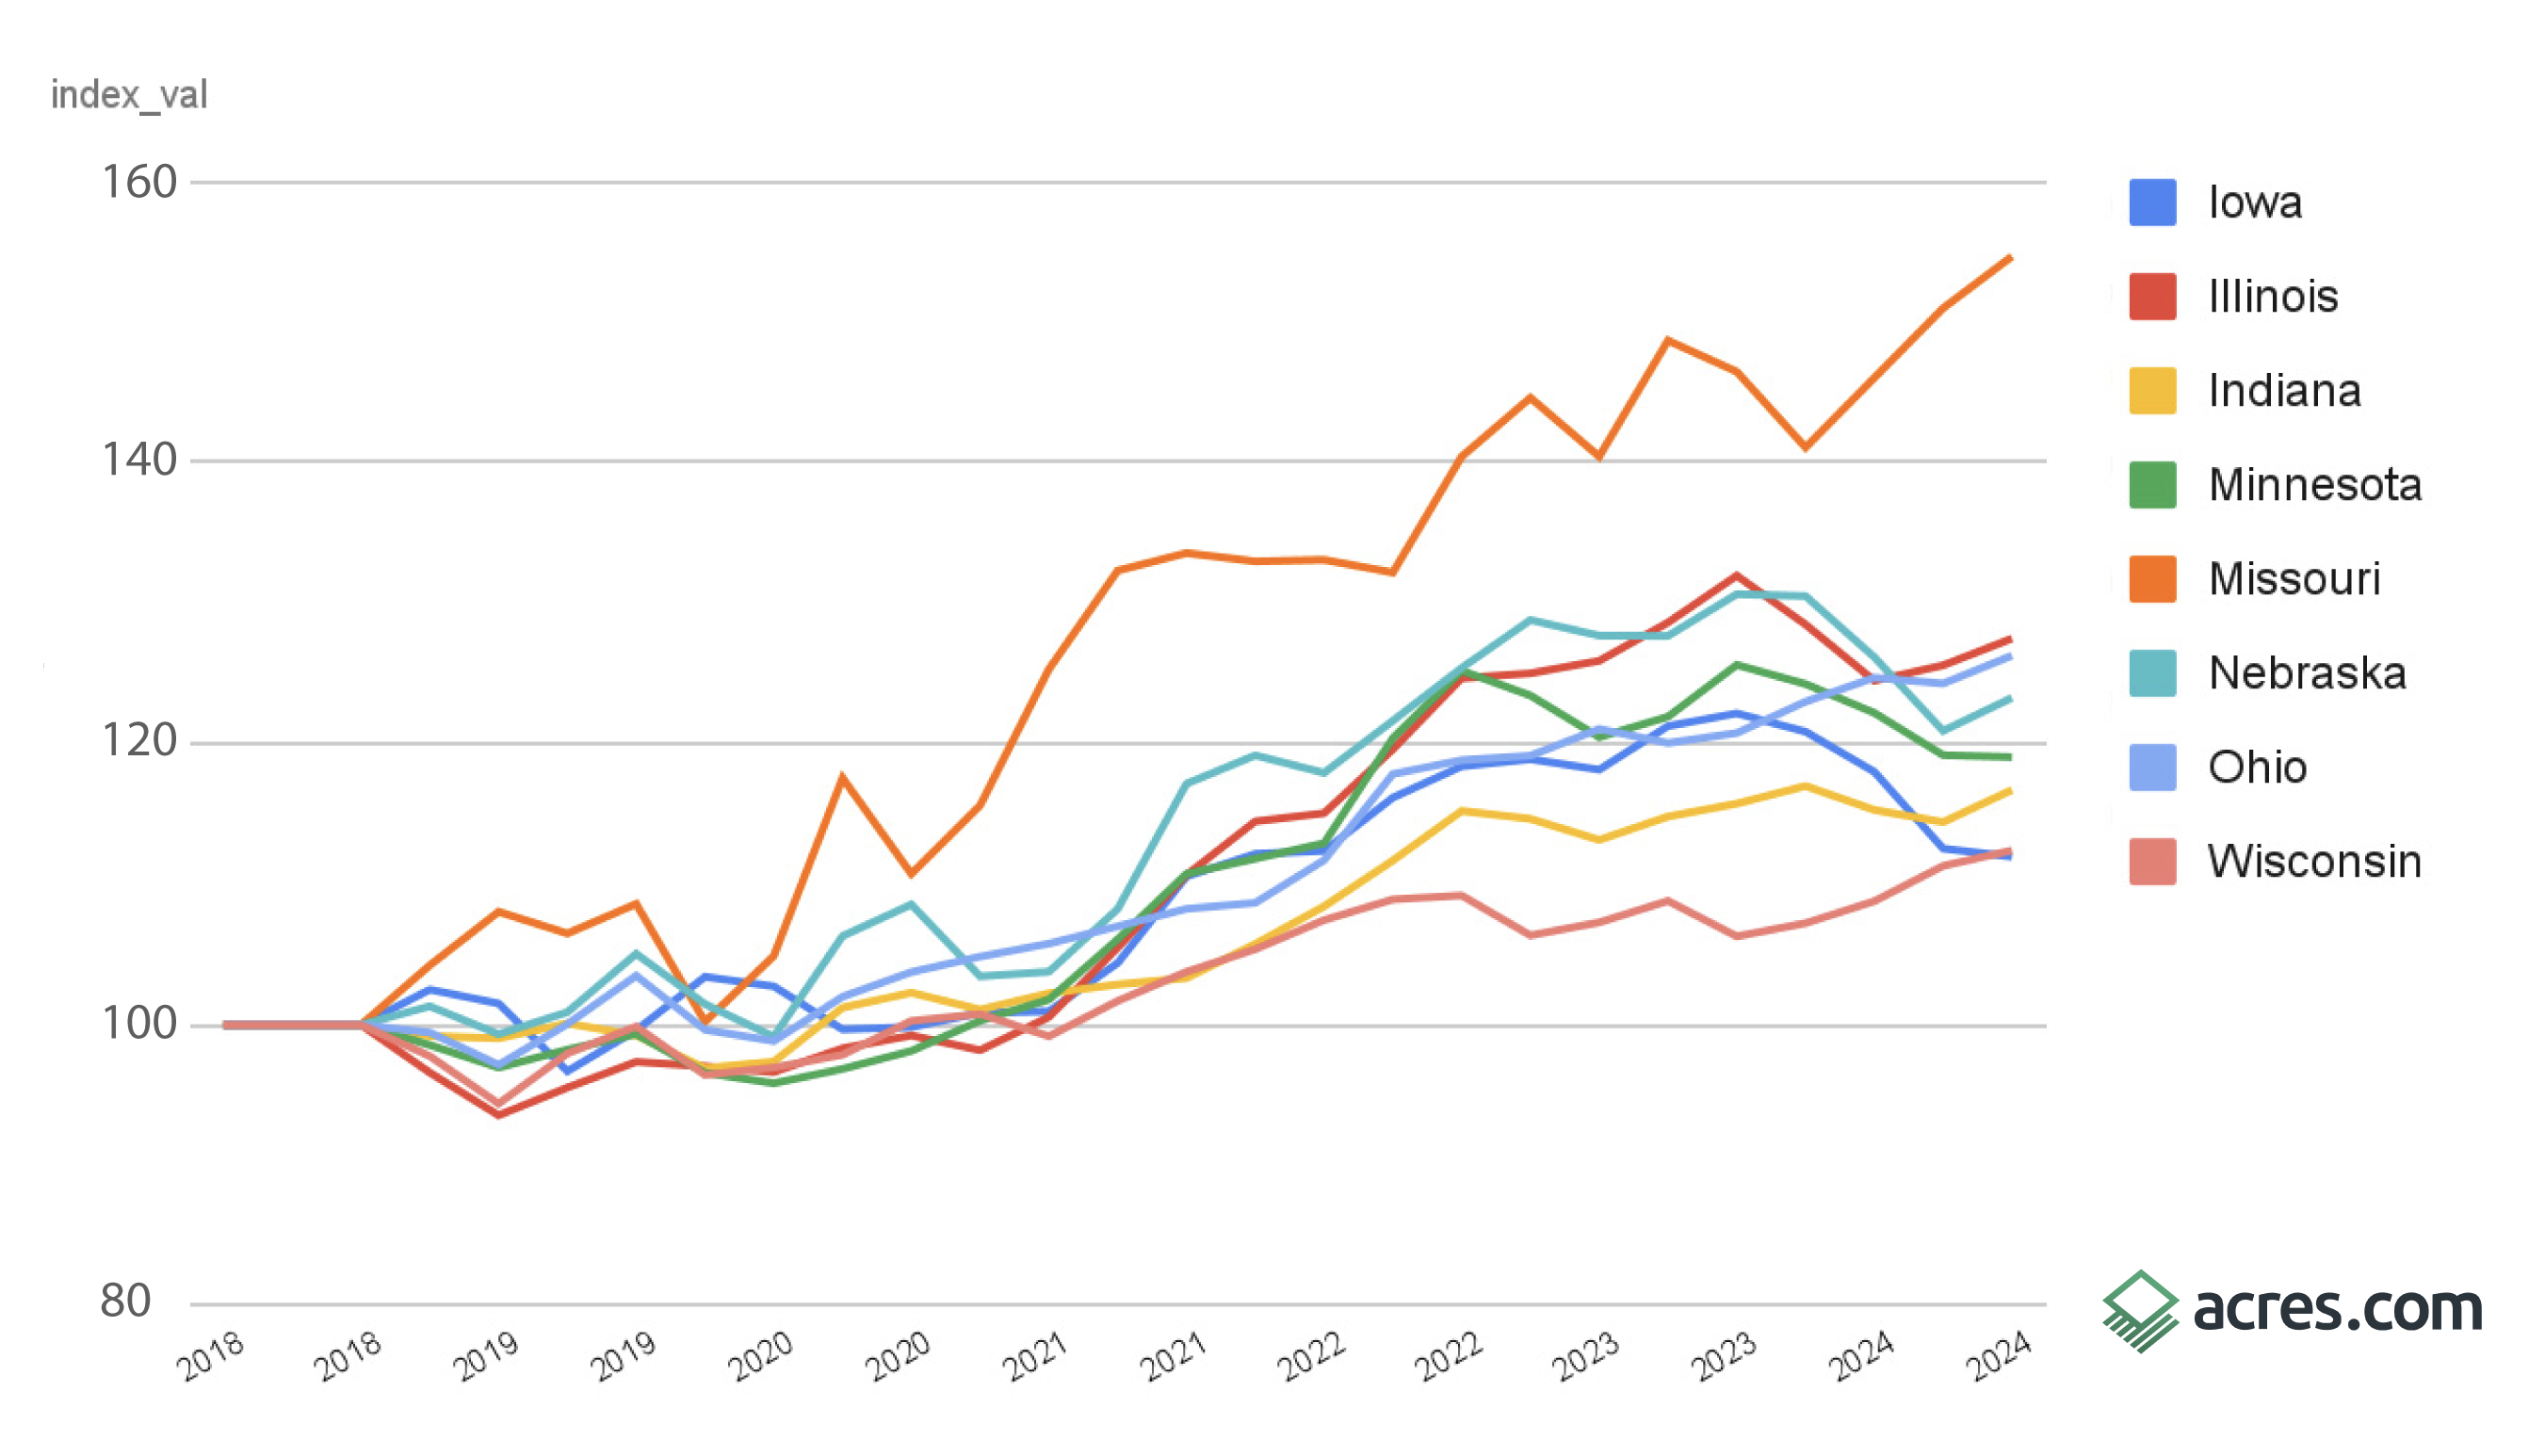
The index spans from Q1 2018 to Q4 2024, tracking trends in farmland values across multiple dimensions. This long-term data view enables detailed analysis of pricing shifts and regional performance over time.
Farmland Index in Key Midwest States: Q1 2018 - Q4 2024
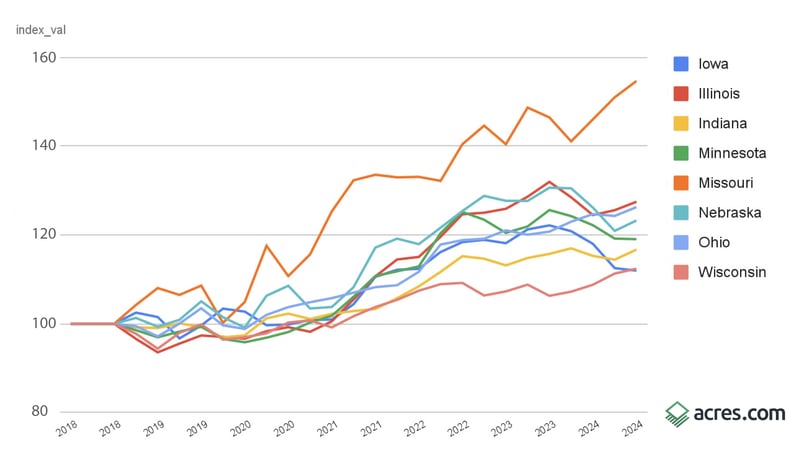
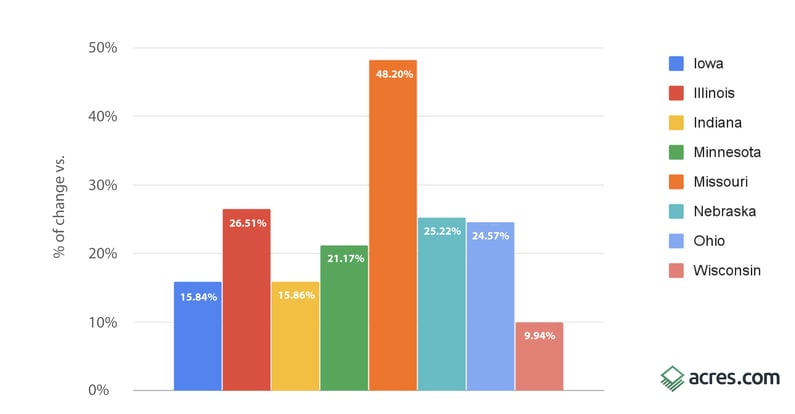
The baseline represents the reference point against which all changes in farmland value are measured—specifically, Q1-Q4 2018 in this index. To calculate the percent change since the baseline, we compare the current quarter’s average farmland value to that baseline value. This metric reveals how much farmland prices have appreciated or declined over time and quarter over quarter, offering a long-term and recent perspective on market performance. It helps stakeholders understand not just current value, but also how much value has been gained (or lost) relative to the start of the data series in a given state or region.
Precent Change vs. Baseline
The quarter-over-quarter percent change measures how farmland values have shifted compared to the previous quarter. It’s calculated by comparing the average value in the latest quarter (Q4 2024) to that in the prior quarter (Q3 2024). This metric captures short-term market movement, highlighting recent gains or declines in land prices. By examining these shifts, readers can spot emerging trends, seasonal effects, or early signs of market acceleration or slowdown.
Percent Change Q4 2024 vs Q3 2024
Farmland values in the Midwest held steady from 2018 to 2020, but the onset of the COVID-19 pandemic introduced volatility to agricultural markets. As policymakers responded with historically low interest rates, demand for farmland began to climb. From 2021 to 2023, values surged—driven by strong commodity prices, record farm incomes, and rising inflation.
That trend slowed in 2024 as inflation persisted and interest rates jumped dramatically. Coupled with falling commodity prices and high input costs, these shifts caused farmland values to level off.
Looking ahead, uncertainty around tariffs, inflation, and interest rates will continue to weigh on the market. Still, farmland has historically been more stable than other commodities and shows low correlation with the stock market—making it a resilient asset in times of economic turbulence.
The Acres Farmland Value Index gives you more than a number—it gives you context. Built on actual sales and focused on agricultural heartland states, it equips stakeholders with reliable insights to value land with confidence. Whether you’re a landowner, investor, or broker, this index offers a clear view of the farmland market’s pulse.
Kosciusko County farm sells for $20,000 an acre, highlighting strong demand for high-quality farmland in Indiana.
Discover how Brown County South Dakota farmland sold for $7,600/acre. Explore what drives value in this 108-acre agricultural and recreational...
Farmland in Dekalb County, Indiana, sold for $22,566 per acre, highlighting the demand for high-quality, productive land with development potential.
