GIS & Mapping
Map Highlight: California Fire Perimeters Map
Discover how Acres’ free Fire Perimeters Map simplifies research and planning for projects near California’s fire zones.
Explore the intricate dynamics of California's farmland values and trends, from crop sales to water districts, in this comprehensive report.
California stands at the forefront of the global agricultural sector, not just as a powerhouse in the United States but as a pivotal area shaping the landscape of agricultural production worldwide. California's agricultural industry, marked by its diversity and innovation, accounts for approximately two-thirds of the nation's fruit and nut production and a third of its vegetables. California uniquely produces essential crops such as almonds, olives, pistachios, and walnuts, along with a broad array of specialty and truck crops.
Due to its diversity, the valuation of agricultural land in California is multifaceted and deeply intertwined with a host of factors including the raw potential of regional soils, microclimates, access to water, and crop markets. Farmland values are influenced heavily by the suitability and optionality for crops on a given property. It is also critical to understand the value of improvements (i.e. trees, vines, and associated production maturity) on any given parcel, and therefore the importance of accurate data is more evident in California compared to other farmland markets.
Moreover, economic conditions significantly influence farmland values, including supply and demand dynamics for each crop and overarching macroeconomic factors like the recent supply shocks induced by the pandemic. We capture the dynamics of these farmland values throughout this report for pre-pandemic, pandemic, and post-pandemic time periods, but importantly, California land values change continuously and require constant attention by professionals in the industry.
Our report begins with an analysis of the overall trends in farmland sales across California with a focus on the Central Valley. We delve into the dynamic landscape of California land values, focusing on the period from Q1 2018 to Q4 2023. Our analysis is underpinned by information from thousands of land transactions and offers an in-depth exploration of farmland sales, pricing trends, crop information, and the impact of the pandemic and agricultural surface water districts on land values in the Central Valley.
We start with an analysis of the number, acreage, and total dollar volume for transactions throughout the study period. Following this, we provide a deeper set of insights in a series of price per acre trends and water district maps by crop type, available in the full report download. Notably, we scrutinized the individual sales used in the analysis and to generate the figures for discussion.
We do not suggest this report is all-encompassing, but that it uniquely captures the dynamic cropland market across the Central Valley over an extended and somewhat volatile period. Intended for professionals within the land valuation, brokerage, lending, and investment sectors, this report is crafted to serve as a resource for informed decision-making and strategic benchmarking.
The Acres transaction database hosts millions of transactions across the lower 48 states and many of the additional data required for understanding land values. The underlying data that fuels our insights is accessible through acres.com, offering stakeholders a gateway to a deeper understanding of the forces shaping California's farmland values at the field level.
To learn more about the methodology used in this report download the full pdf.

In this section, we present a detailed analysis of total land sales from 2018 to 2023, breaking down the data quarterly to reveal trends in the number of farmland sales transactions, acres sold, and total expenditures on farmland. We analyze both permanent and annual cropland transactions. In the full report we provide the median price per acre by water district and crop type on a quarterly basis for the study time period.
In Figures 1-3, we examine the number of transactions, acres sold, and sales volume in millions of dollars for permanent crops above 10 acres. We include Almonds, Citrus, Grapes, Pistachios, Stone Fruit, Walnuts, and Miscellaneous Tree Crops that were between $1,000 and $70,000 per acre. Overall, we observed significant increases in the number and volume of sales during peak pandemic years, especially in Q4 of 2020 and 2021.
The sales in dollar amounts were also much higher in 2020 and 2021 with more than $1.2 billion in sales and another billion dollar quarter in early 2022. We observe spikes in permanent crop acreage sold in 2019, 2020, and 2021. In Q3 2019, there was a large stone fruit sale that shows prominently, and this highlights the challenges associated with analyzing permanent cropland values as a single entity can generate volatility with a single acquisition. Permanent crop sales picked up substantially again in Q4 of 2023, but the sales in dollar amounts remained lower than in recent years, signifying shifts in permanent cropland values.
Figure 1. Number of Quarterly Permanent Crop Transactions

Figure 2. Acres of Permanent Cropland Sold
Figure 3. Permanent Crop Sales ($ in Millions)
In Figures 4-6, we illustrate the number and volume of annual crop sales. Importantly, annual cropland has more optionality than permanent crops and the number of sales is much less volatile than for permanent crops. We have observed a reduced number of transactions in the post-pandemic period from 2022 through 2023.
Most annual crop sales are fairly stable in terms of sales volume as well. For example, the number and volume of rice, cotton, corn, and alfalfa fluctuates only slightly over the study period, but we see more fluctuations in hay and cereals and in miscellaneous crops. Those fluctuations are particularly noticeable and seemingly correlated with permanent crops in Q4 of 2021, which suggests potential land conversion into permanent crops during the pandemic years.
Figure 4. Number of Quarterly Annual Crop Transactions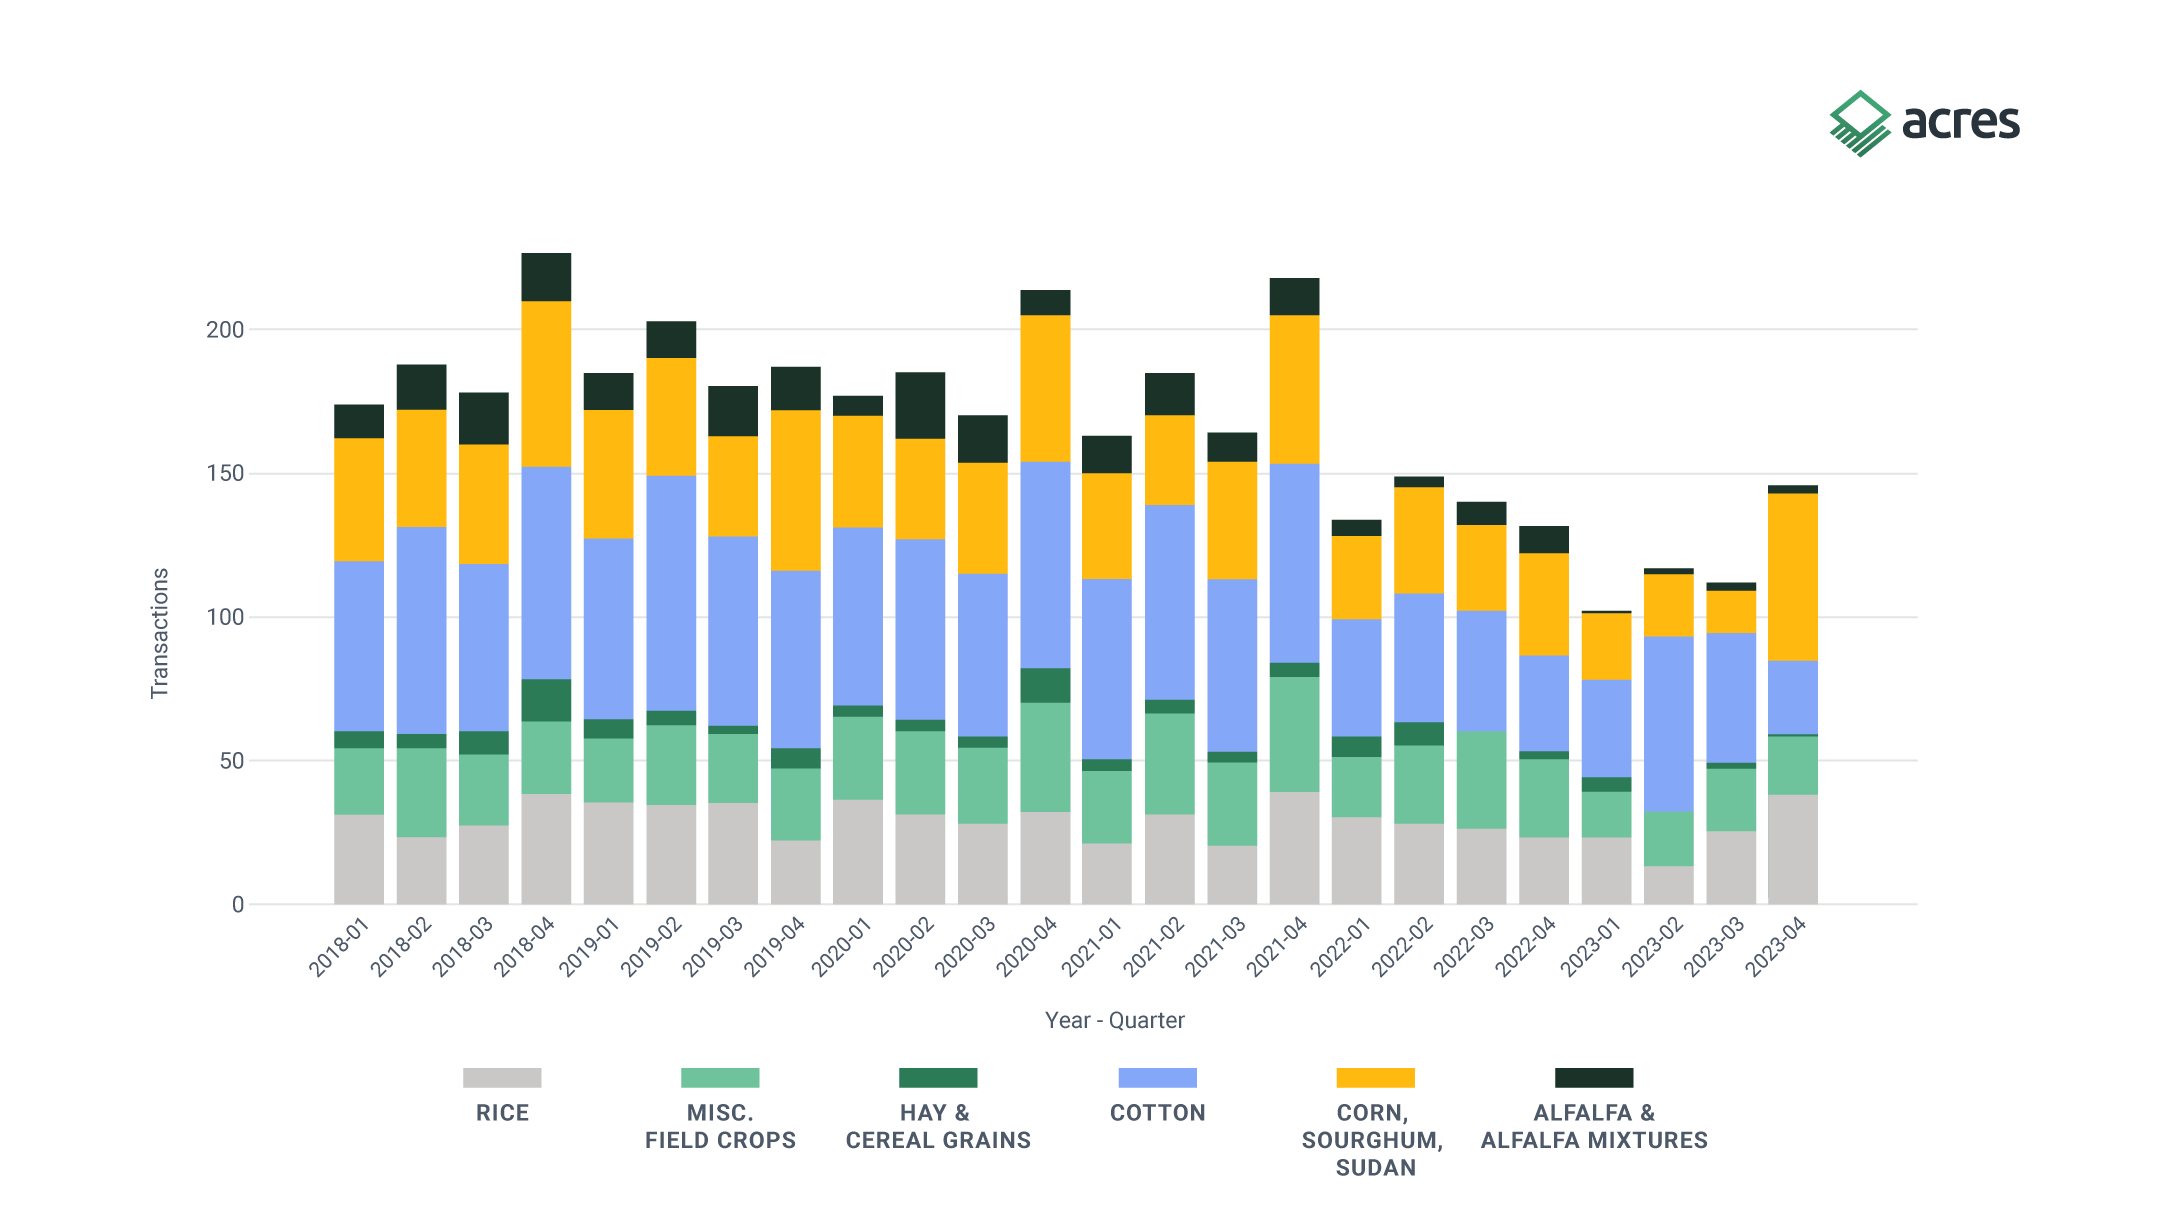
Figure 5. Acres of Annual Cropland Sold
Figure 6. Annual Crop Sales ($ in Millions)
In Figures 7 and 8, we map the median price per acre for annual crops and permanent crops for select agricultural water districts throughout the Central Valley for pre-pandemic (2018-2019), pandemic (2020-2021), and post-pandemic (2022-2023) time periods. Figure 7 suggests that annual cropland (bareground) values are not substantially lower than those in the pre-pandemic period except for a few key regions, and many water districts present higher on a price per acre basis for the study period.
We observe the general trend that eastern districts have higher prices per acre due to proximity to water resources. There tends to be more variable in price per acre values in the southern and northern areas of the Central Valley, presumably due to additional complexities from development and other important factors that drive demand for bare ground.
Figure 8 showcases the dynamic and evolving market for permanent cropland. Overall, there was an observed increase in price per acre from 2018-2019 to 2020-2021. However, by 2022-2023, prices generally plateaued across many water districts and even decreased noticeably in several areas.
While recent periods show declining values for certain crops, as detailed in subsequent analyses, these trends are often contextualized against the backdrop of the abnormally high prices during the pandemic period. Large-scale aggregations offer insights into broad changes in land values, yet an effective analysis of permanent crops necessitates a more detailed examination on a per-crop basis, which the following section will address.
The analysis of California's agricultural land values reveals significant regional variations, driven primarily by water source and quality, microclimates, soil productivity, and specific crop suitability. In the San Joaquin Valley, distinctions between the North and South and the East and West highlight the impact of water districts and soil conditions on land prices, with eastern regions generally benefiting from better soil quality and more reliable surface water access. the "Citrus Belt" between Fresno and Bakersfield sees greater crop optionality with water districts of various reliability that can drive higher land values.
Furthermore, the exploration into specialized crops like almonds within the Central Valley suggests a unique market influence. Wine regions further complicate the valuation landscape, which we omit for further analysis due to the challenges posed by American Viticultural Areas, improvements, age, and variety. There are also differences between coastal and interior areas such as Paso Robles, where east and west divisions mirror variations in land prices.
These findings suggest that water availability, soil conditions, and crop type play critical roles in shaping the economic landscape of California's diverse agricultural regions as well as population centers and developing regions. In the more detailed analysis, we focus specifically on permanent tree crops and annual crops in a band of agricultural water districts in the Central Valley to provide insights while acknowledging we won’t capture every detail or market influence.
Figure 7. Median Price per Acre for Annual Crops across Agricultural Water Districts in the Central Valley.
Note: Water districts with less than 3 observations for the time period were omitted.
Figure 8. Median Price per Acre for Permanent Crops across Agricultural Water Districts in the Central Valley.
Note: Water districts with less than 3 observations for the time period were omitted.
California's farmland market is notoriously complex. For greater detail, including breakdowns by water districts and permanent crop types, download the full report for free and keep an eye out for occasional updates from Acres.

Discover how Acres’ free Fire Perimeters Map simplifies research and planning for projects near California’s fire zones.
Limited bidder price interest led to ultimate price per acre illustrative of a difficult time for almond ranches in California’s Central Valley.
A generational California ranch sale in the Sierra Foothills—proving well-managed land still moves fast. Discover what drove this deal.
