

Trends
Heartland Farmland Values: Key Findings from Our Report
Heartland farmland values explained by industry experts. Get key findings from the Heartland Report and watch the full conversation.
Explore transaction-based insights on farmland values and trends across the Midwest Heartland region between Q1 of 2020 and Q2 of 2023.
In partnership with our in-house data science experts, we proudly present a land values report for the Heartland drawn from Acres’ ever-expanding reservoir of recorded land transactions. Our approach sets us apart. Instead of the usual state-centric reports or those grounded solely in survey data, we’ve curated a Heartland analysis using transaction data to encapsulate the Midwest Corn Belt while diving deep into the nuances of local land value shifts in state-level analysis.
This edition shines a spotlight on farmland values across the pivotal Corn Belt region by delineating values across crop reporting districts and states and creating distinctions in farmland soil productivity classes. Our analysis spans observations made from January 2020 through June 2023, focusing on Class A to C soils as classified using soils data from the USDA Natural Resources Conservation Service across the states of Iowa, Illinois, Indiana, Minnesota, Nebraska, Missouri, Ohio, and Wisconsin.
We understand that each state has its own set of unique attributes shaping its land values regionally. That's why in this Heartland Report, we offer both overarching state benchmarks for enthusiasts keen on discerning farmland value trajectories and a state-centric dissection catered to those keen on the intricate factors influencing local land values.
Our insights are rooted in data sourced from Acres’ unmatched farmland sales archive, a comprehensive repository inclusive of auctions, public listings, and courthouse-documented sales. When fused with supplementary data on soil profiles and crop histories, it forms a robust foundation for facilitating a layered comprehension of land value trends – from across states in the Heartland down to individual farms.
For clarity on terminologies employed, we invite you to check our Glossary. If you're curious about our meticulous data processing and categorization, you may also review the Appendix. Both the Glossary and Appendix are available in the PDF version.
This report will help you examine the intricacies of the land market by benchmarking and discerning market dynamics to equip you to understand land sales within and beyond your region.
About the Acres Farmland Sales Database
Trends Through Different Lenses
Evolution of Farmland Sales Volume
The Heartland Report, drawing from Acres' comprehensive database, incorporates over 37,000 observed high-quality farmland sales spanning from Q1 of 2020 to Q2 in 2023. Our stringent selection criteria for this analysis entailed omitting sales occurring outside the specified timeframe, those encompassing less than 20 acres, and certain anomalies, which might not be representative of general farmland market dynamics.
Outliers have been systematically identified and removed on parameters such as price per acre, price per tillable acre, and price per productivity index on a state-by-state basis. Such an approach ensures the presentation of untainted trends, devoid of biases possibly induced by extreme or uncharacteristic sales.
Certain sales may exhibit atypically low prices, categorized as "arm's-length transactions." On the other end of the spectrum, there are instances where buyers, due to specific motivations, might disburse exceptionally high amounts for certain properties. Including such outliers in our study could skew and misrepresent genuine land value trends. For a deeper dive into our methodological rationale behind outlier elimination, the Appendix in the downloadable PDF provides detailed insights.
Each transaction within the Acres database is meticulously detailed, capturing individual sale characteristics and encompassing supplementary data that aids in estimating the intrinsic value of farmland.
Within the Corn Belt, purchasing decisions of farmland frequently revolve around the price per tillable acre and the price associated with regional productivity index values.
We leveraged two metrics in creating this report: tillable acres and productivity indices. The term 'tillable acres' delineates land tracts that are viable for crop cultivation, while productivity indices offer a comparative metric, capturing the potential non-irrigated crop yield of different soil types on an average per parcel basis. By leveraging these metrics, we enhance the granularity of our insights, presenting refined analyses of farmland value trajectories at both regional and localized scales.
Figure 1. shows the number of sales, segmented quarterly and categorized by each state encompassed in the Heartland Report.
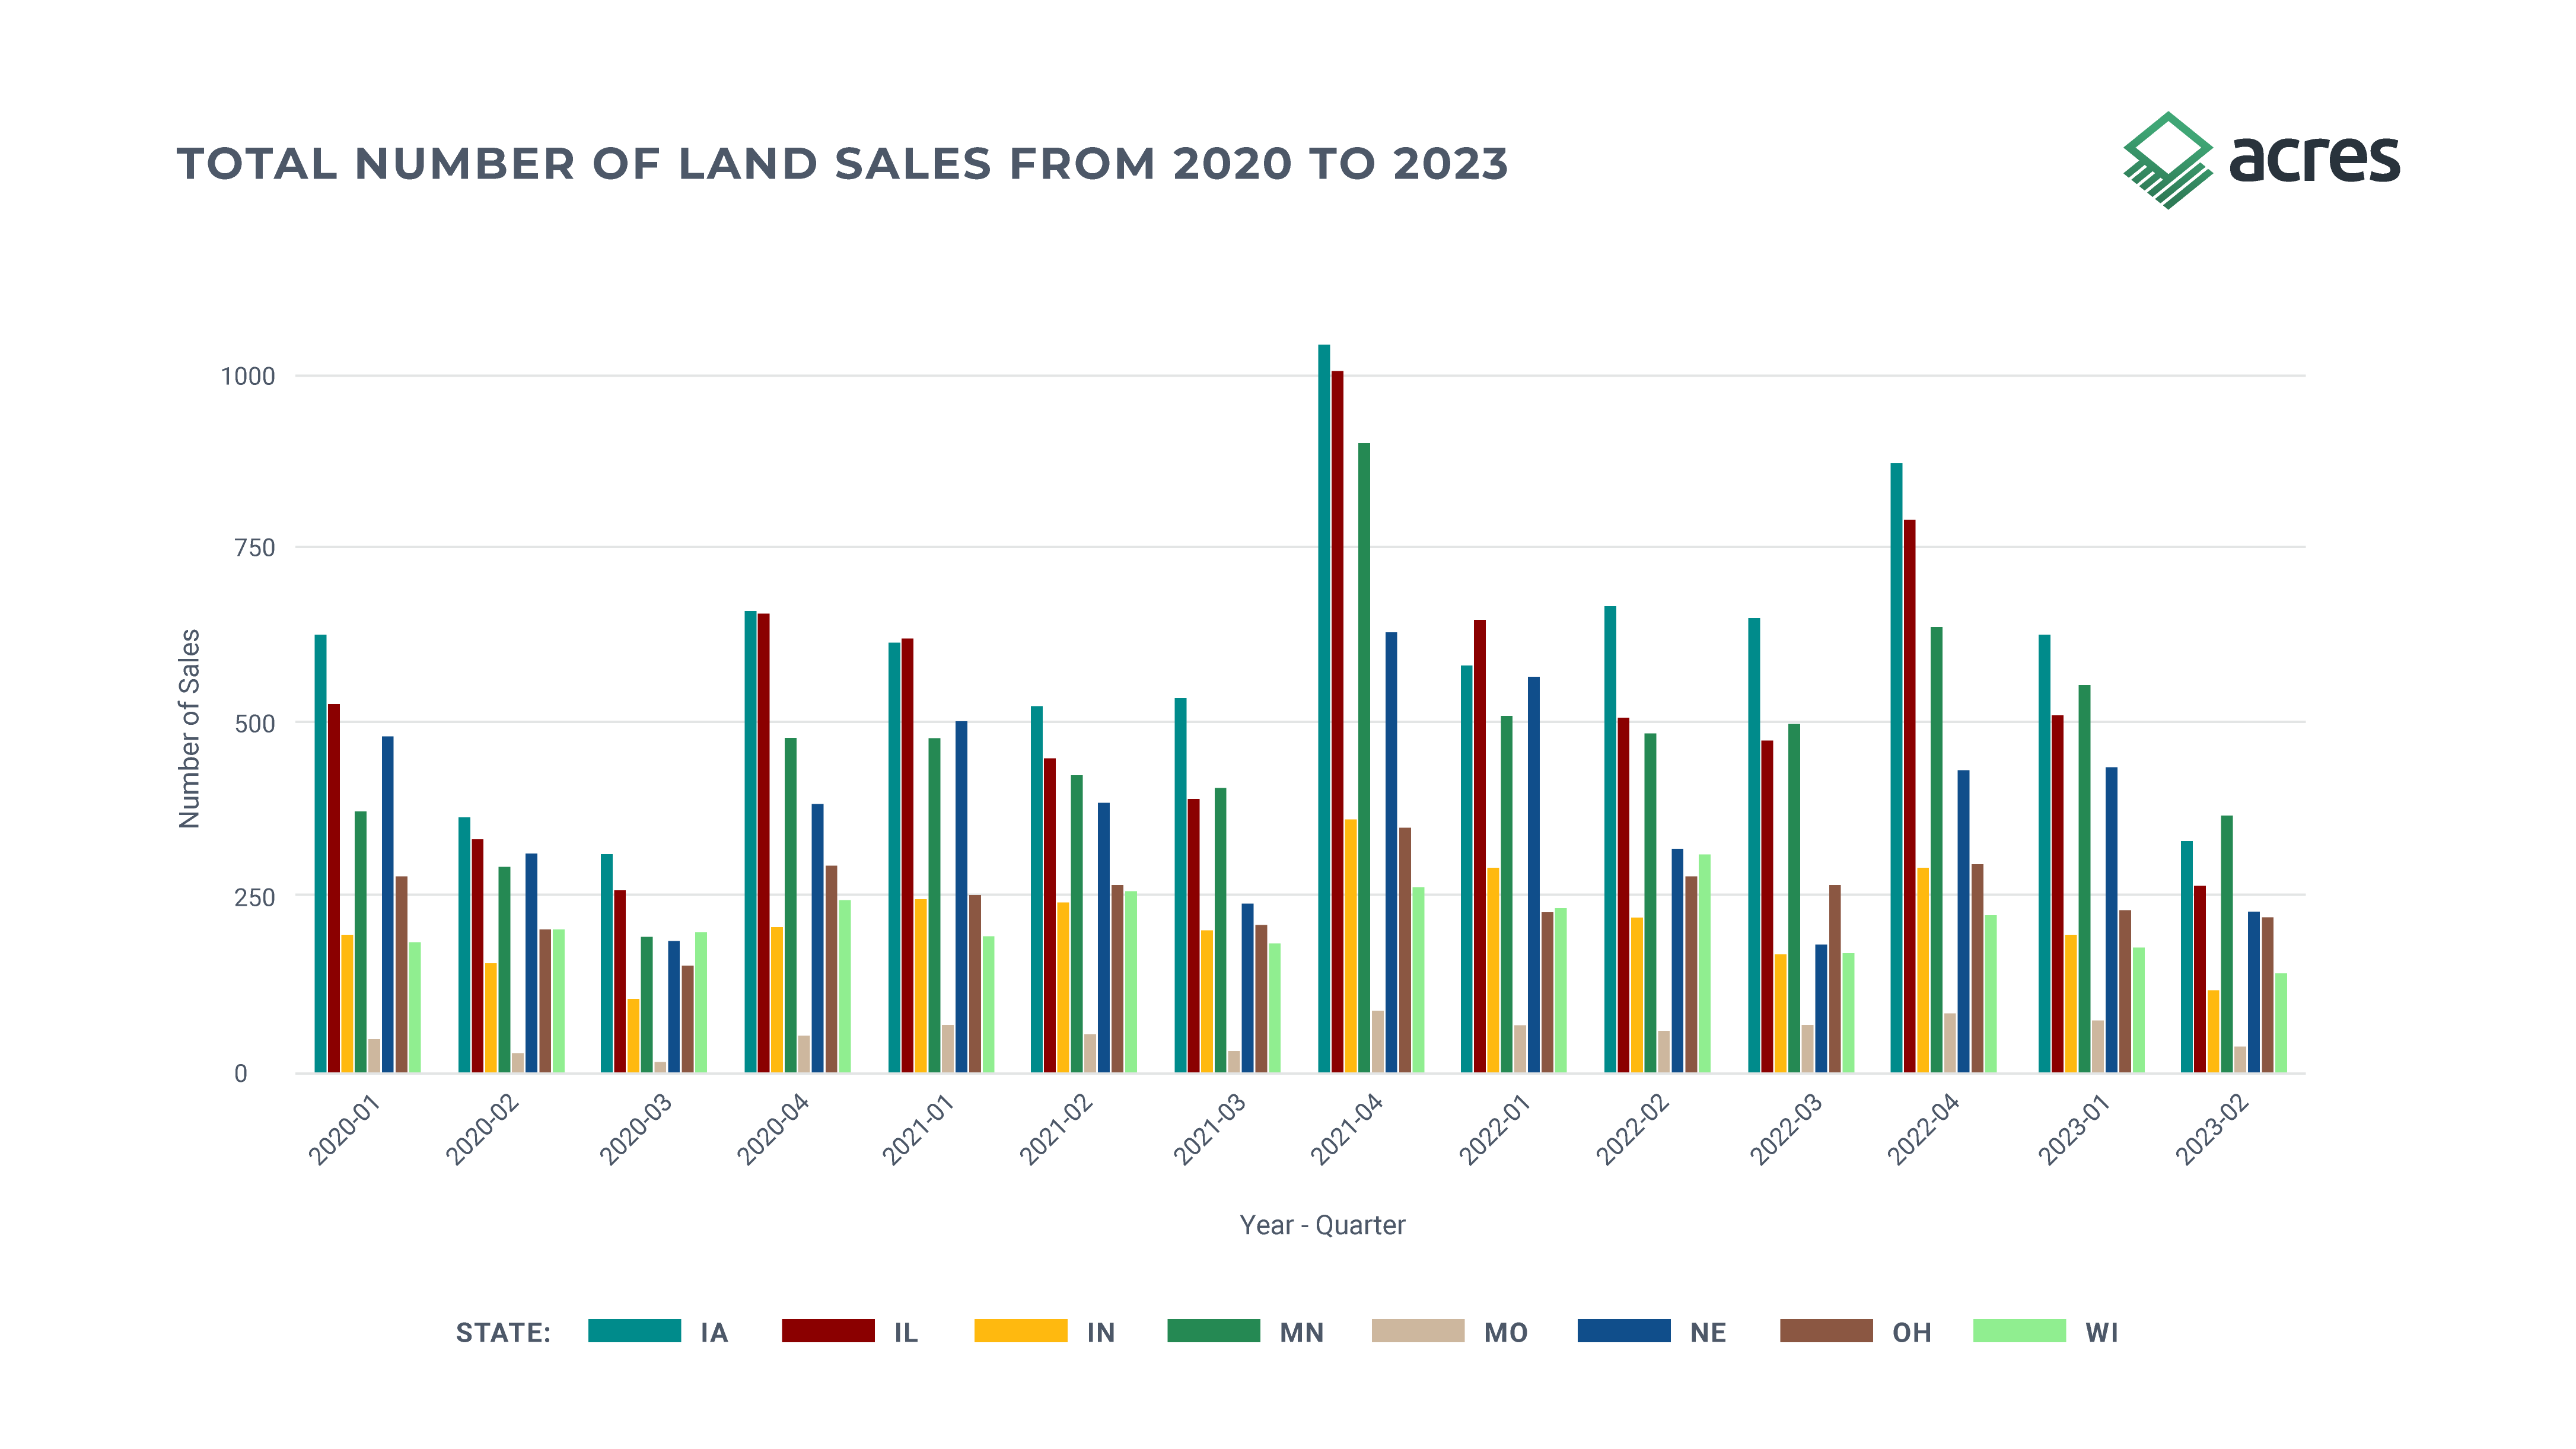 Note: Only counties in the corn belt are included for Missouri. Specifically, the counties in the following Crop Reporting Districts: Central West, North West, North Central, North East, Central, and East Central districts.
Since the beginning of 2020, the Midwest has witnessed a marked positive trend in farmland values. The initial uptick in 2020 was spurred on by a confluence of events and circumstances: the rollout of pandemic stimulus measures, robust commodity prices, and crop yields that favorably impacted farm balance sheets. This bolstered financial positions and empowered farmers, enabling them to participate in bidding for farmland without being excessively reliant on debt financing.
A cyclical pattern emerged in our observations where the market typically exhibits a softer disposition during Q2 and Q3 annually. This can be attributed to the agricultural production season. However, despite this periodic and seasonal softening, the overarching trend underscores consistent year-over-year growth.
Recent events and economic shifts in the first half of 2023 have introduced new variables into this dynamic. The shadow of macroeconomic volatility, the initial ebb in commodity prices in 2023, coupled with escalating interest rates have applied a dampening effect on the rate at which land values appreciate.
This cooling effect is most evident in the usual seasonal easing witnessed in Q2. While the general trend retains its robustness, we will have to watch sales in Q3 and Q4 of 2023 to understand any potential changes in seasonality and volatility. Thus far, 2023 looks to continue both the seasonal and growth trends observed over the last few years.
This report adopts a structured approach. We start with an overarching view of trends throughout the Heartland, outlining our insights into subsections that focus on metrics such as price per acre, price per tillable acre, and price per productivity index.
This is complemented by additional subsections examining total sales volume trends, the percentage increase in farmland values relative to the 2020 average price per acre as our reference point, and a mapping of Q2 2023 values at the crop reporting district level across the Heartland. Subsequently, we have an additional section with a deeper dive into more meticulous state-level analysis that further explores the nuances of price per productivity indices and land classes.
The trajectory of land values has trended upward, moving from approximately $7,500 per acre in Q1 2020 to around $9,500 per acre by Q2 2023 across the Heartland.
Iowa consistently serves as a benchmark in terms of price per acre trends. We also observe strong, positive trends in Illinois, and even see the average price per acre surpassing Iowa during a few quarters. This dynamism in Illinois' land values became especially pronounced during two distinct phases: first between Q4 2020 and Q1 2021, and then once more between Q4 2022 and Q1 2023.
Minnesota's land market is characterized by its inherent regional differences in farmland values. The state's southern region, when juxtaposed against the Red River Valley, often commands higher prices reflective of higher yields and higher population density. Sales in the northern region receive a fairly substantial discount to those in central and southern regions. This difference can be attributed to the diverse market conditions prevalent across these areas, but as we’ll see in more detailed analysis of each state, we observe stronger movement in Red River Valley farmland in terms of price per acre.
Missouri and Nebraska display a somewhat more erratic trend pattern. Such fluctuations can be explained by considering the contrasting profiles of farmland sold, namely irrigated versus non-irrigated properties, as well as pronounced regional variations in factors like soil productivity, water districts, and topography. In addition, Missouri is a non-disclosure state, so farmland sales were less prevalent in early years prior to the addition of Acres’ curated sales database in late 2021.
Figure 2. shows quarterly price per acre trends from Q1 2020 to Q2 2023.
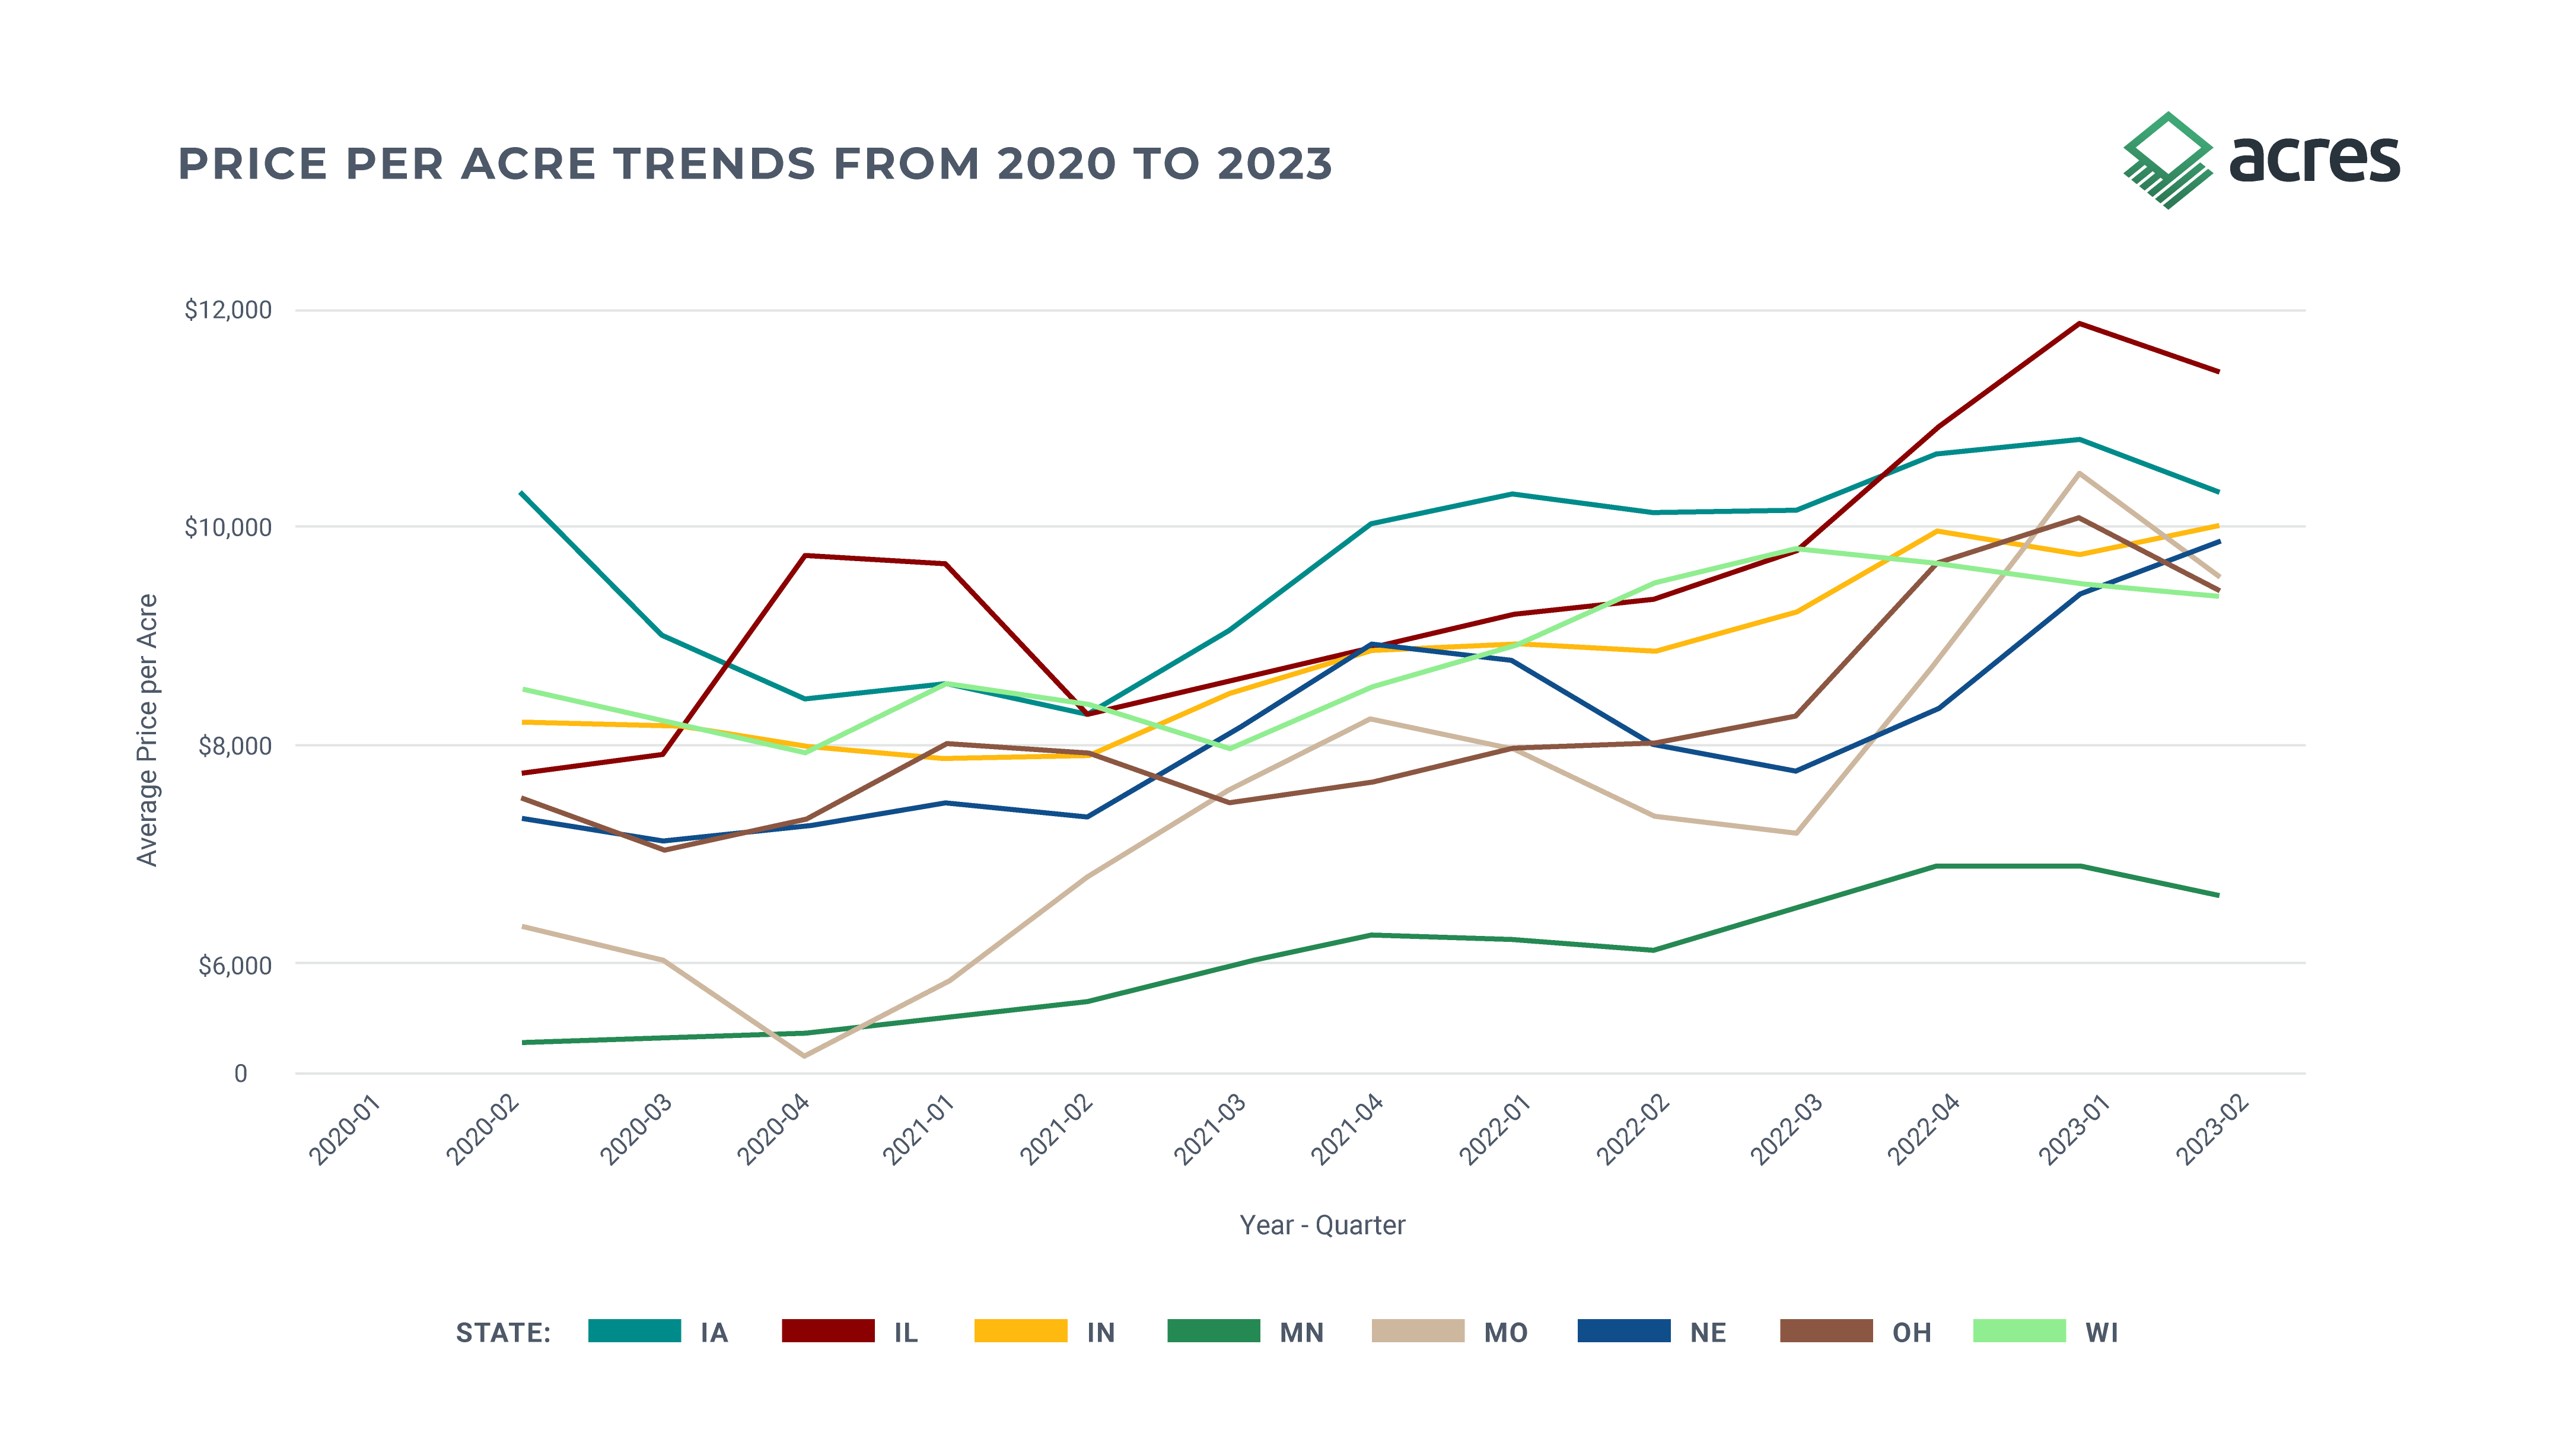
Note: Values represent a moving average of the present and previous quarter. For example, the Q2 2021 value is the weighted average of 2021 Q1 and Q2 price per acre.
As we examine sales based on a per tillable acre metric, Illinois emerges prominently at the forefront. As of Q2 2023, it has reached an impressive average of nearly $14,000 per tillable acre, marking a significant ascent from under $10,000 in Q1 2020. A highlight to underline here is the unanimous uptick in prices per tillable acre across all seven states during our period of study. While Minnesota maintains a more tempered, yet consistent growth trajectory on the lower end of the spectrum, the likes of Iowa, Missouri, Indiana, Nebraska, Ohio, and Wisconsin exhibit parallel seasonality in their price per tillable acre trends. This synchronized movement culminates with these states hovering just under $12,000 per tillable acre in Q1 and Q2 2023. The seasonality and volatility of prices in Missouri is primarily driven by the diversity of productive farmland across the state.
Figure 3. Shows quarterly price per tillable acre trends from Q1 2020 to Q2 2023.
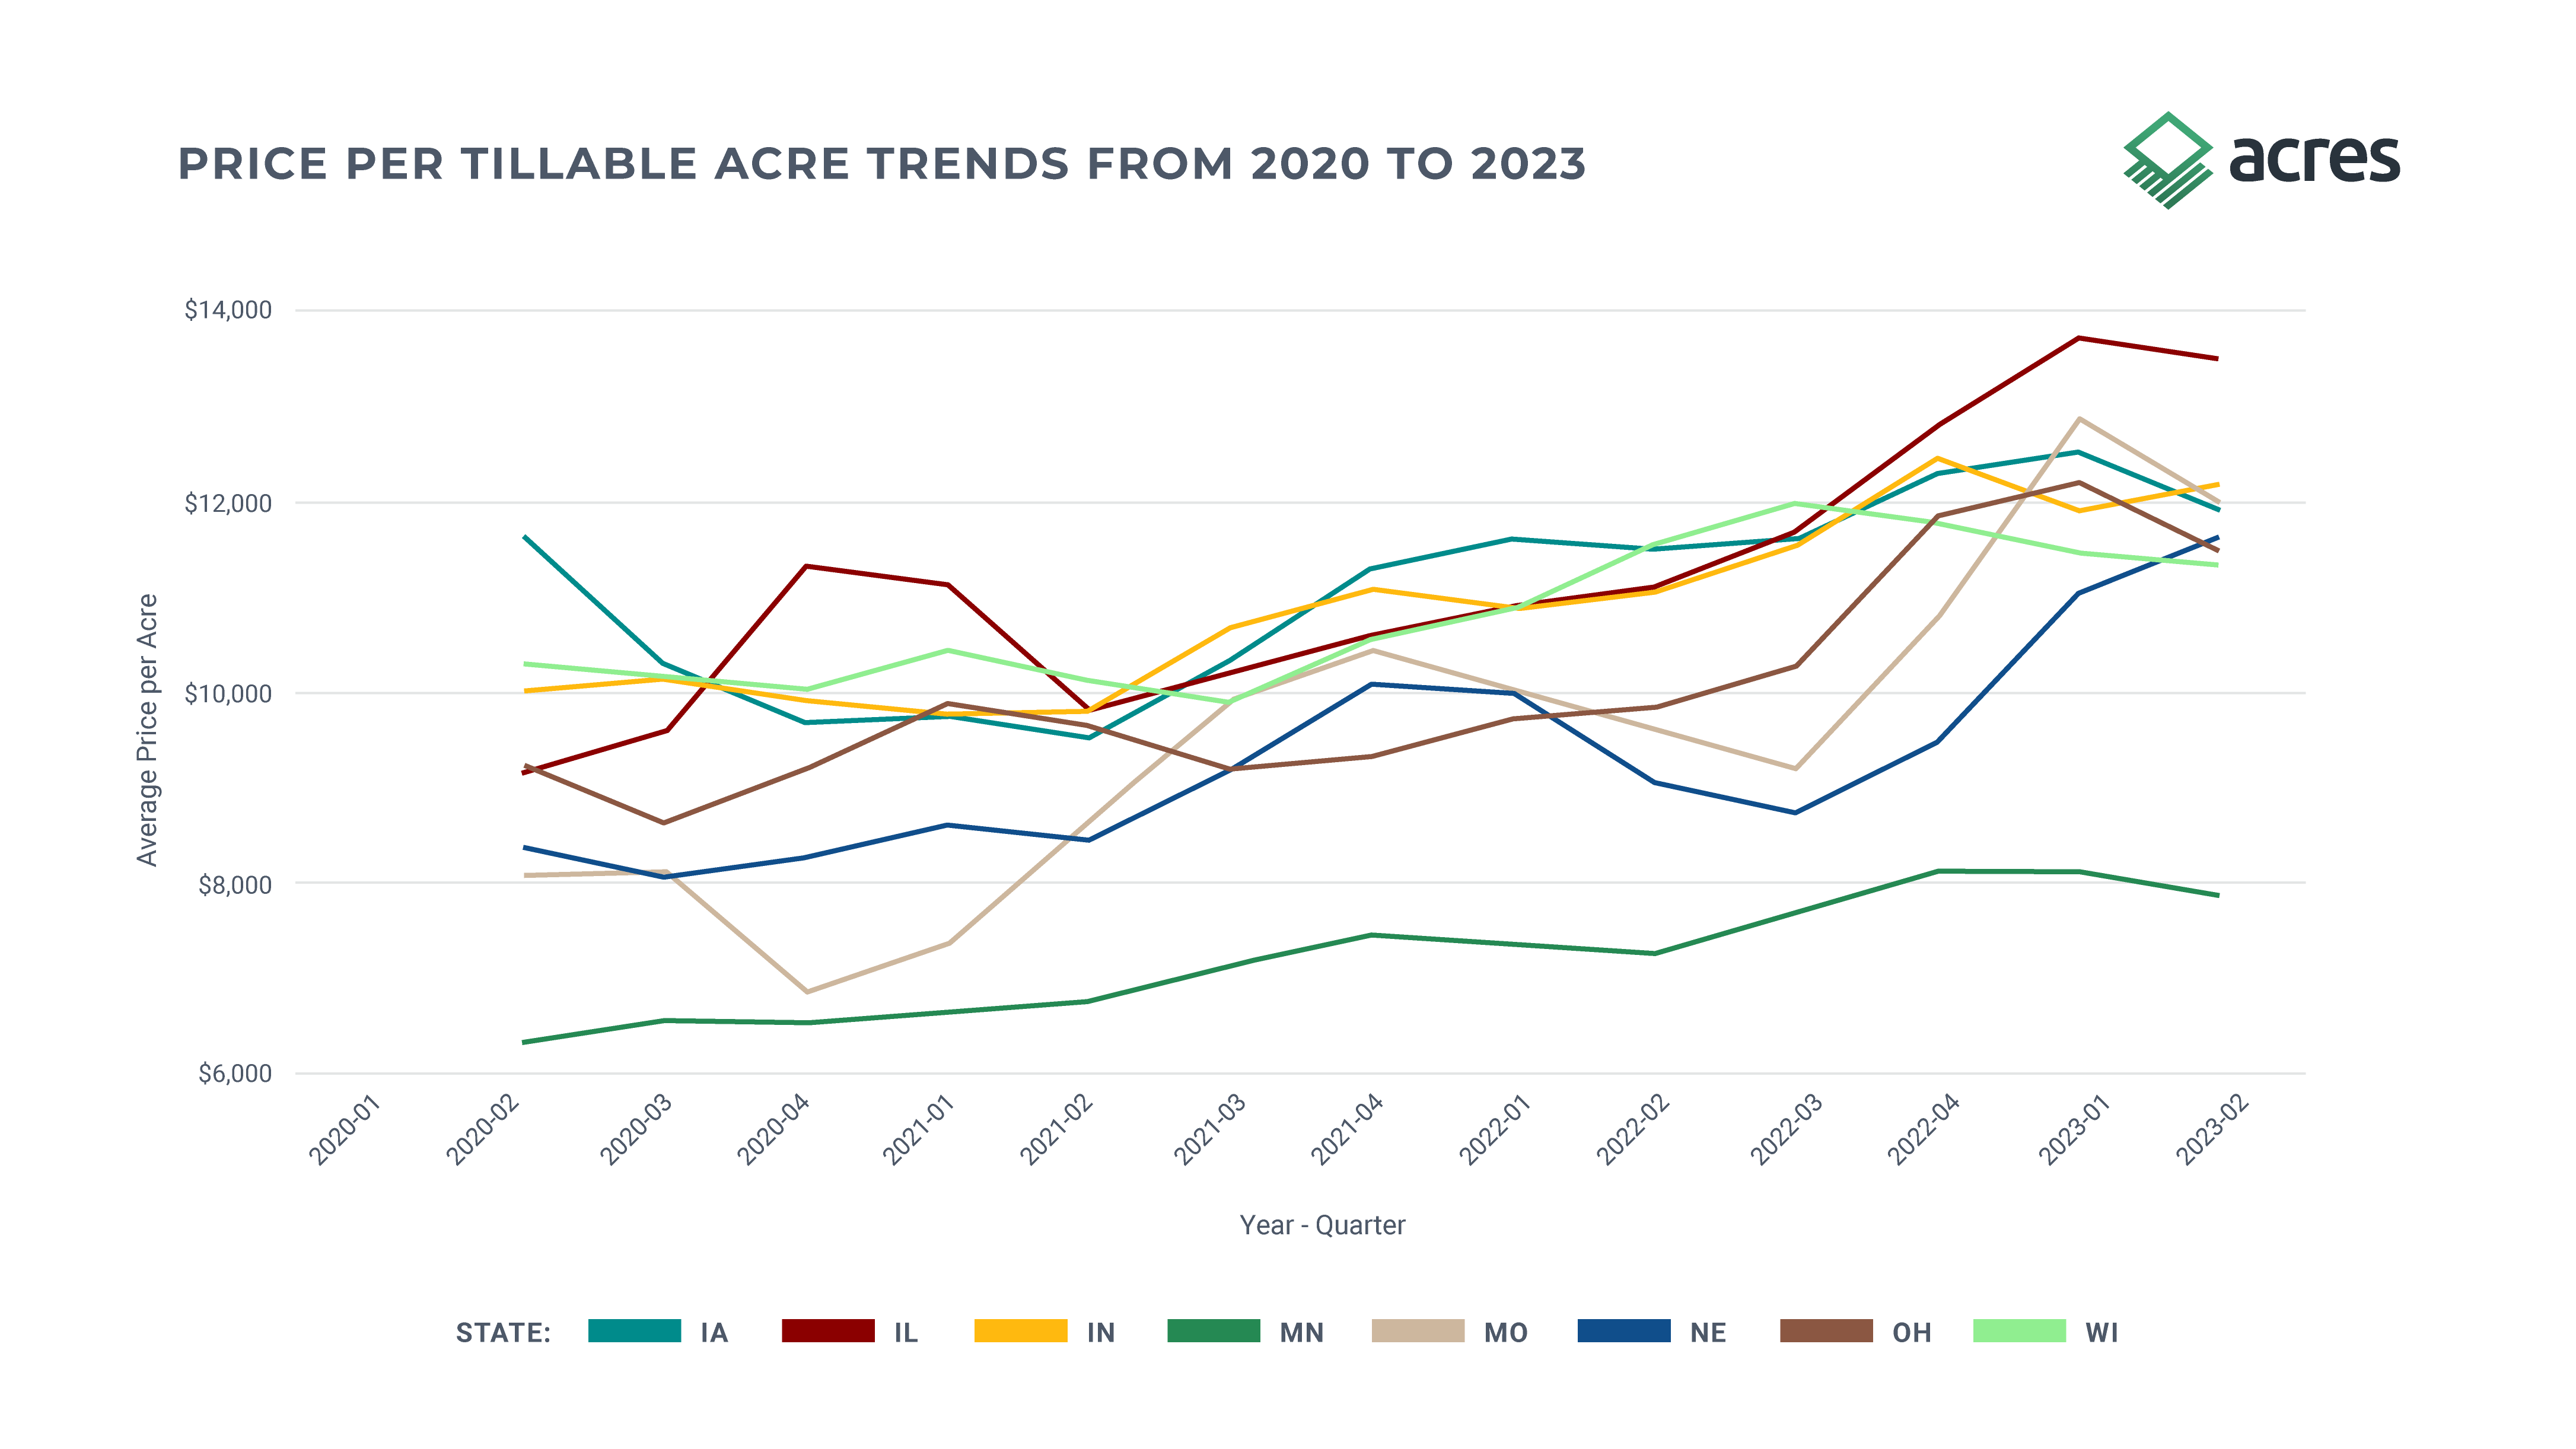
Note: Values represent a moving average of the present and previous quarter. For example, the 2021 Quarter 2 value is the weighted average of 2021 Q1 and Q2 price per acre.
Price per Productivity Index (PI) is calculated based on regionally appropriate soil, climate, and topographic information in each state. No productivity index is perfect, and they each have strengths and weaknesses in acting as a metric of relative, inherent land productivity for non-irrigated cropland. For more information about soil indices, also called soil scores, you can read further in A Quick Guide to Soil Scores.
The following state soil indices are used in each respective state: Corn Suitability Rating-2 (CSR2) in Iowa, Illinois Productivity Index (IPI) in Illinois, Crop Productivity Index (CPI) in Minnesota, and Weighted Average Productivity Index (WAPI) in Indiana. In Nebraska, Missouri, Ohio, and other states, they rely on the National Crop Commodities Productivity Index (NCCPI) because no state soil productivity index exists. These are the designations we use throughout the analysis in this report for each state, and we may reference “PI” generally across all states.
Midwest land values have remained strong and stable in the face of inflation, in-line with historical performance of farmland during inflationary environments. Price per PI has consistently increased in all states with the greatest gains observed in Illinois, Ohio, and Nebraska.
For deeper analysis of regional prices across productivity classes in select states, please check the full report here.
Figure 4. shows the price per productivity index (PI) trends for Q1 2020 to Q2 2023.
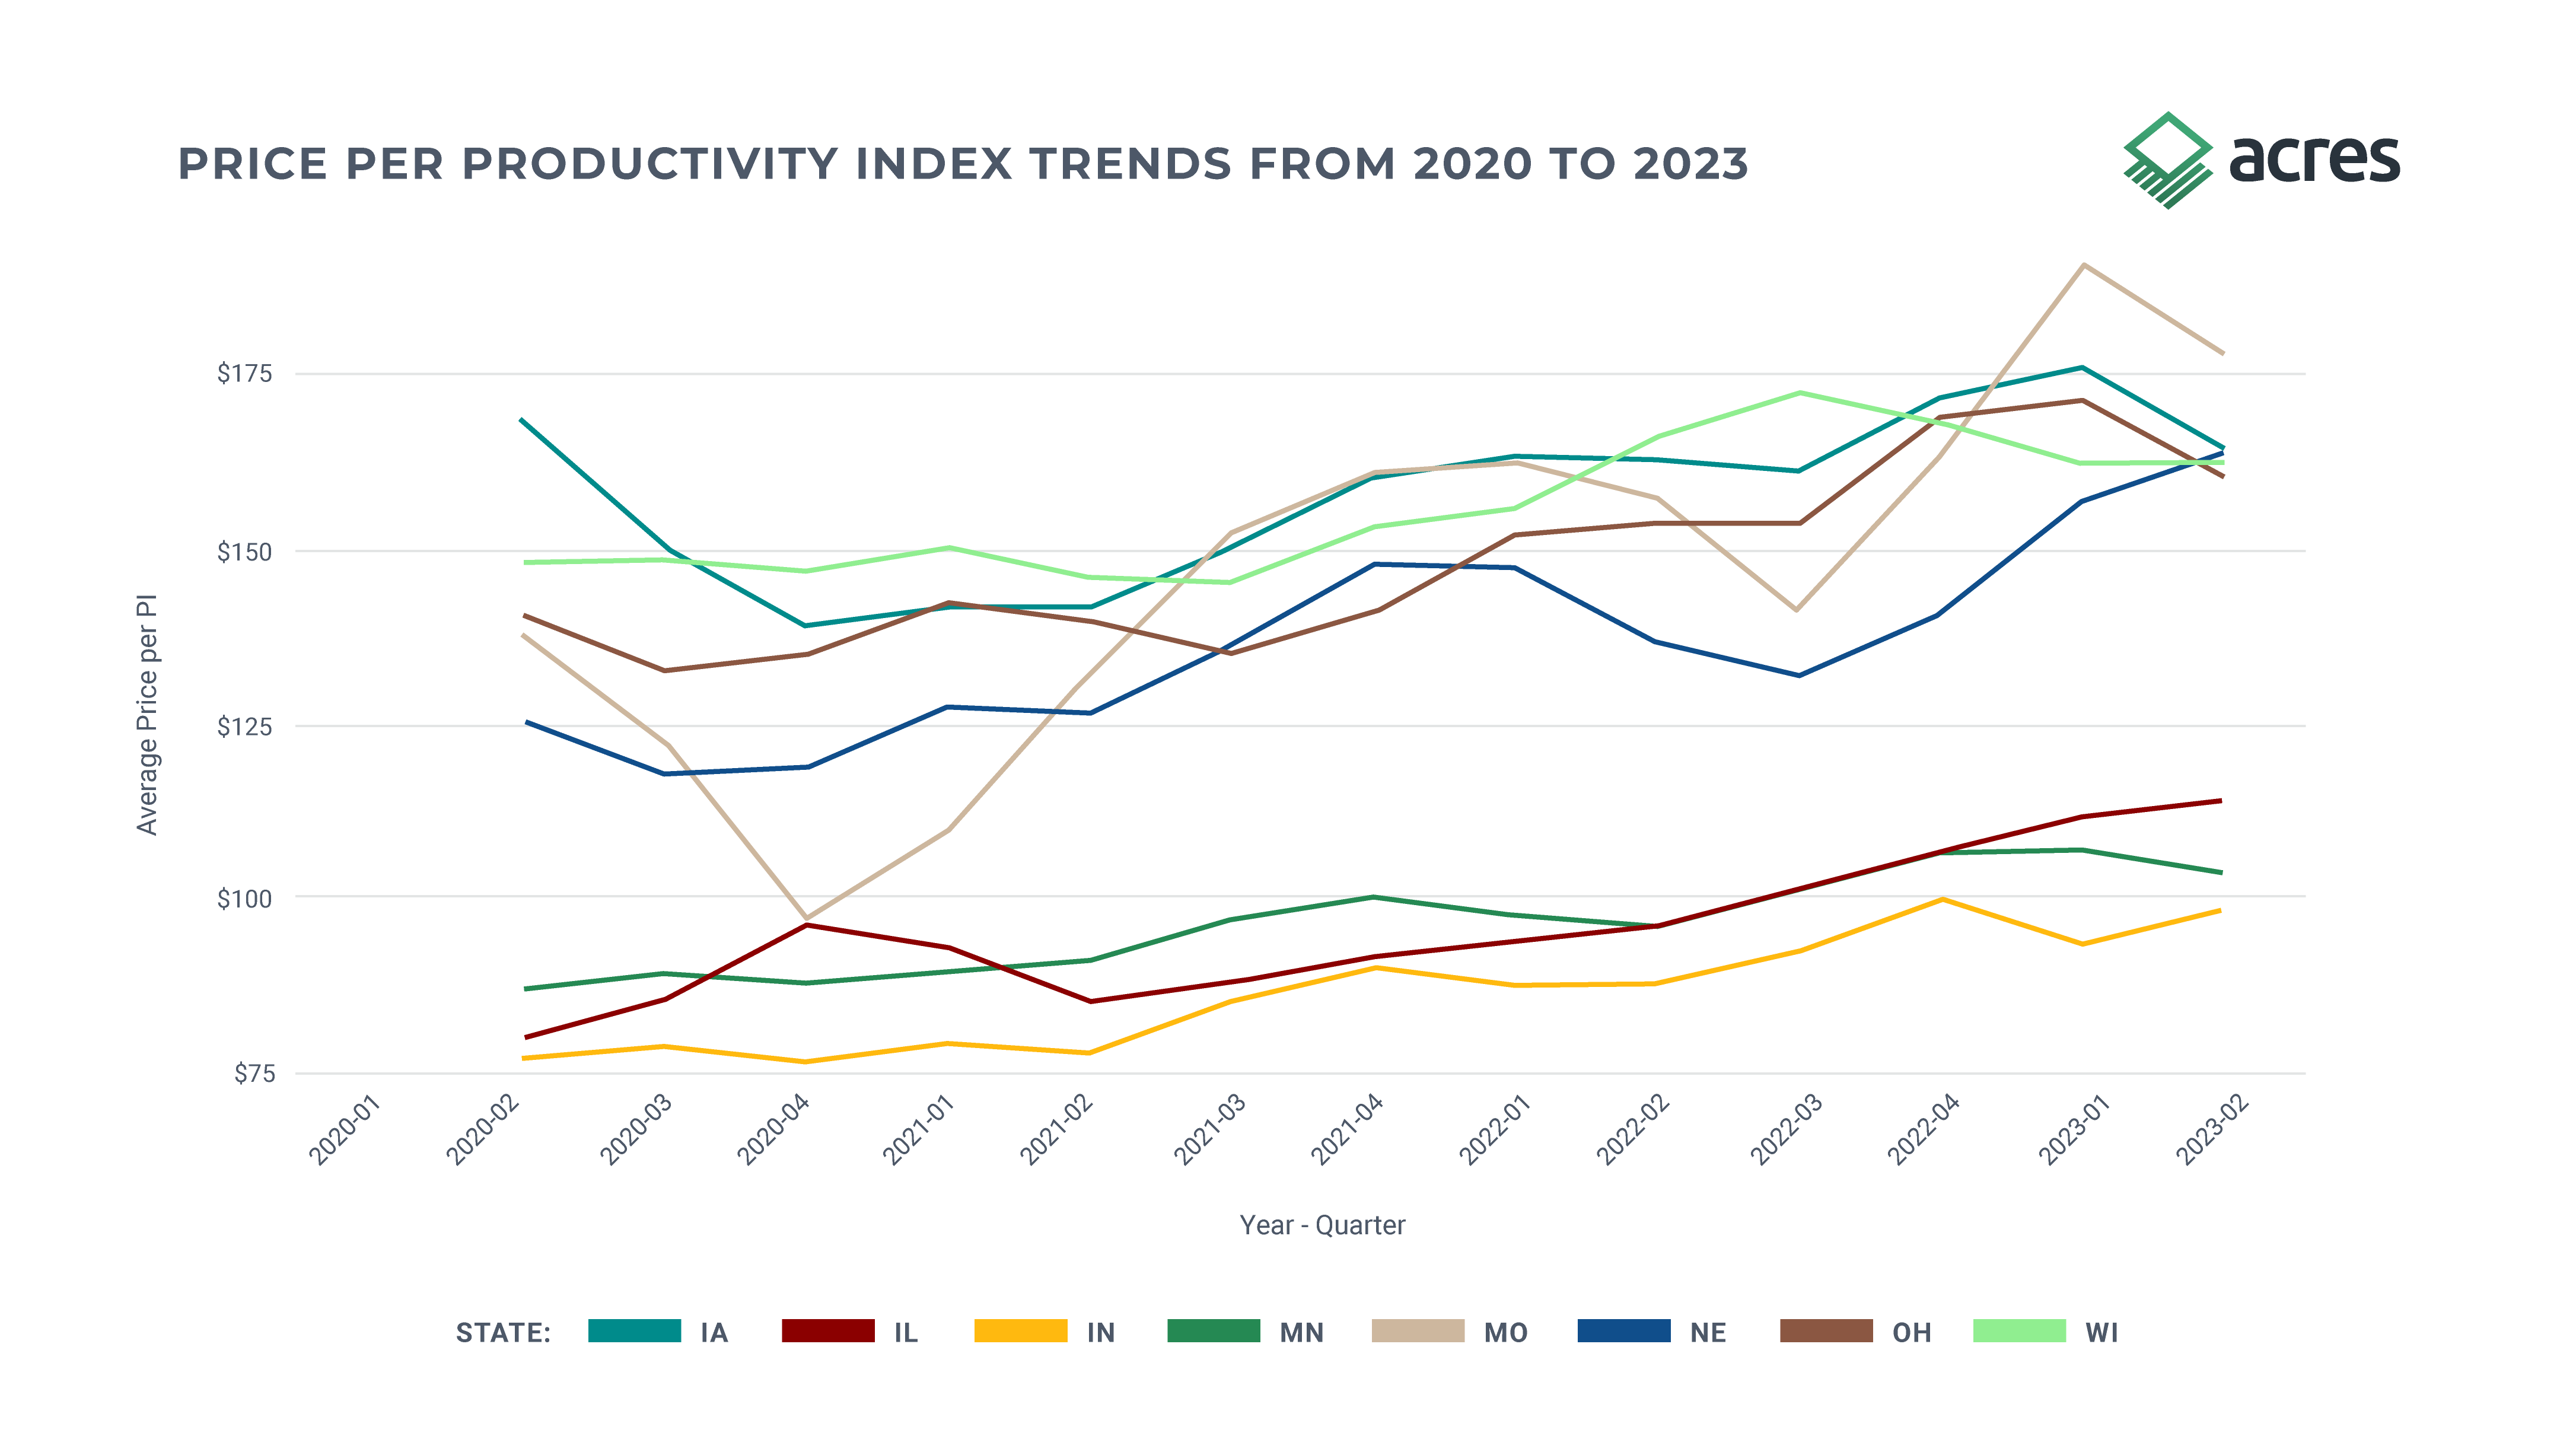
Note: Values represent a moving average of the present and previous quarter. For example, the 2021 Quarter 2 value is the weighted average of 2021 Q1 and Q2 price per acre. Additionally, the productivity indices are used for each state: CSR2 in IA, IPI in IL, WAPI in IN, CPI in MN, and NCCPI for remaining states.
Between Q1 of 2020 and Q2 of 2023, we observed over $30 billion in land transactions across the eight Heartland states included in the analysis. Just over $8 billion of farmland was sold in Illinois across approximately 625 thousand acres, with Iowa a not-too-distant second at approximately $6.6 billion in transactions across more than 750 thousand acres. The remaining states all accounted for several billion dollars in land transactions each over the study time period. Importantly, these numbers are only inclusive of the high quality sales in our analysis, so these are very conservative numbers for the volume of farmland transactions across the Heartland.
During the study period, farmland sales in the Heartland exceeded a staggering $30 billion in total value, with transactions in 2022 setting records for price per acre in several states.
State total sales and acreage sold in Figures 5 and 6 illustrate the highly seasonal nature of quarter-over-quarter farmland sales. Quarters 4 and 1 typically experience higher volumes and quarters 2 and 3 experience softening due to the crop production season. Quarter 4 of 2021 was the most active quarter for farmland transactions in recent years with nearly $1.25 billion in total sales across more than 110,000 acres in Illinois alone. A similar spike in transaction volume occurred in quarter 4 of 2022 and the seasonal transaction decline in Q2 and Q3 occurs in each of the four years included in the analysis. Importantly, these numbers do not include the outlier sales removed, so they are conservative estimates of farmland sale volume.
Figure 5. Farmland Total Sales across Heartland States by Quarter, 2020 - 2023.
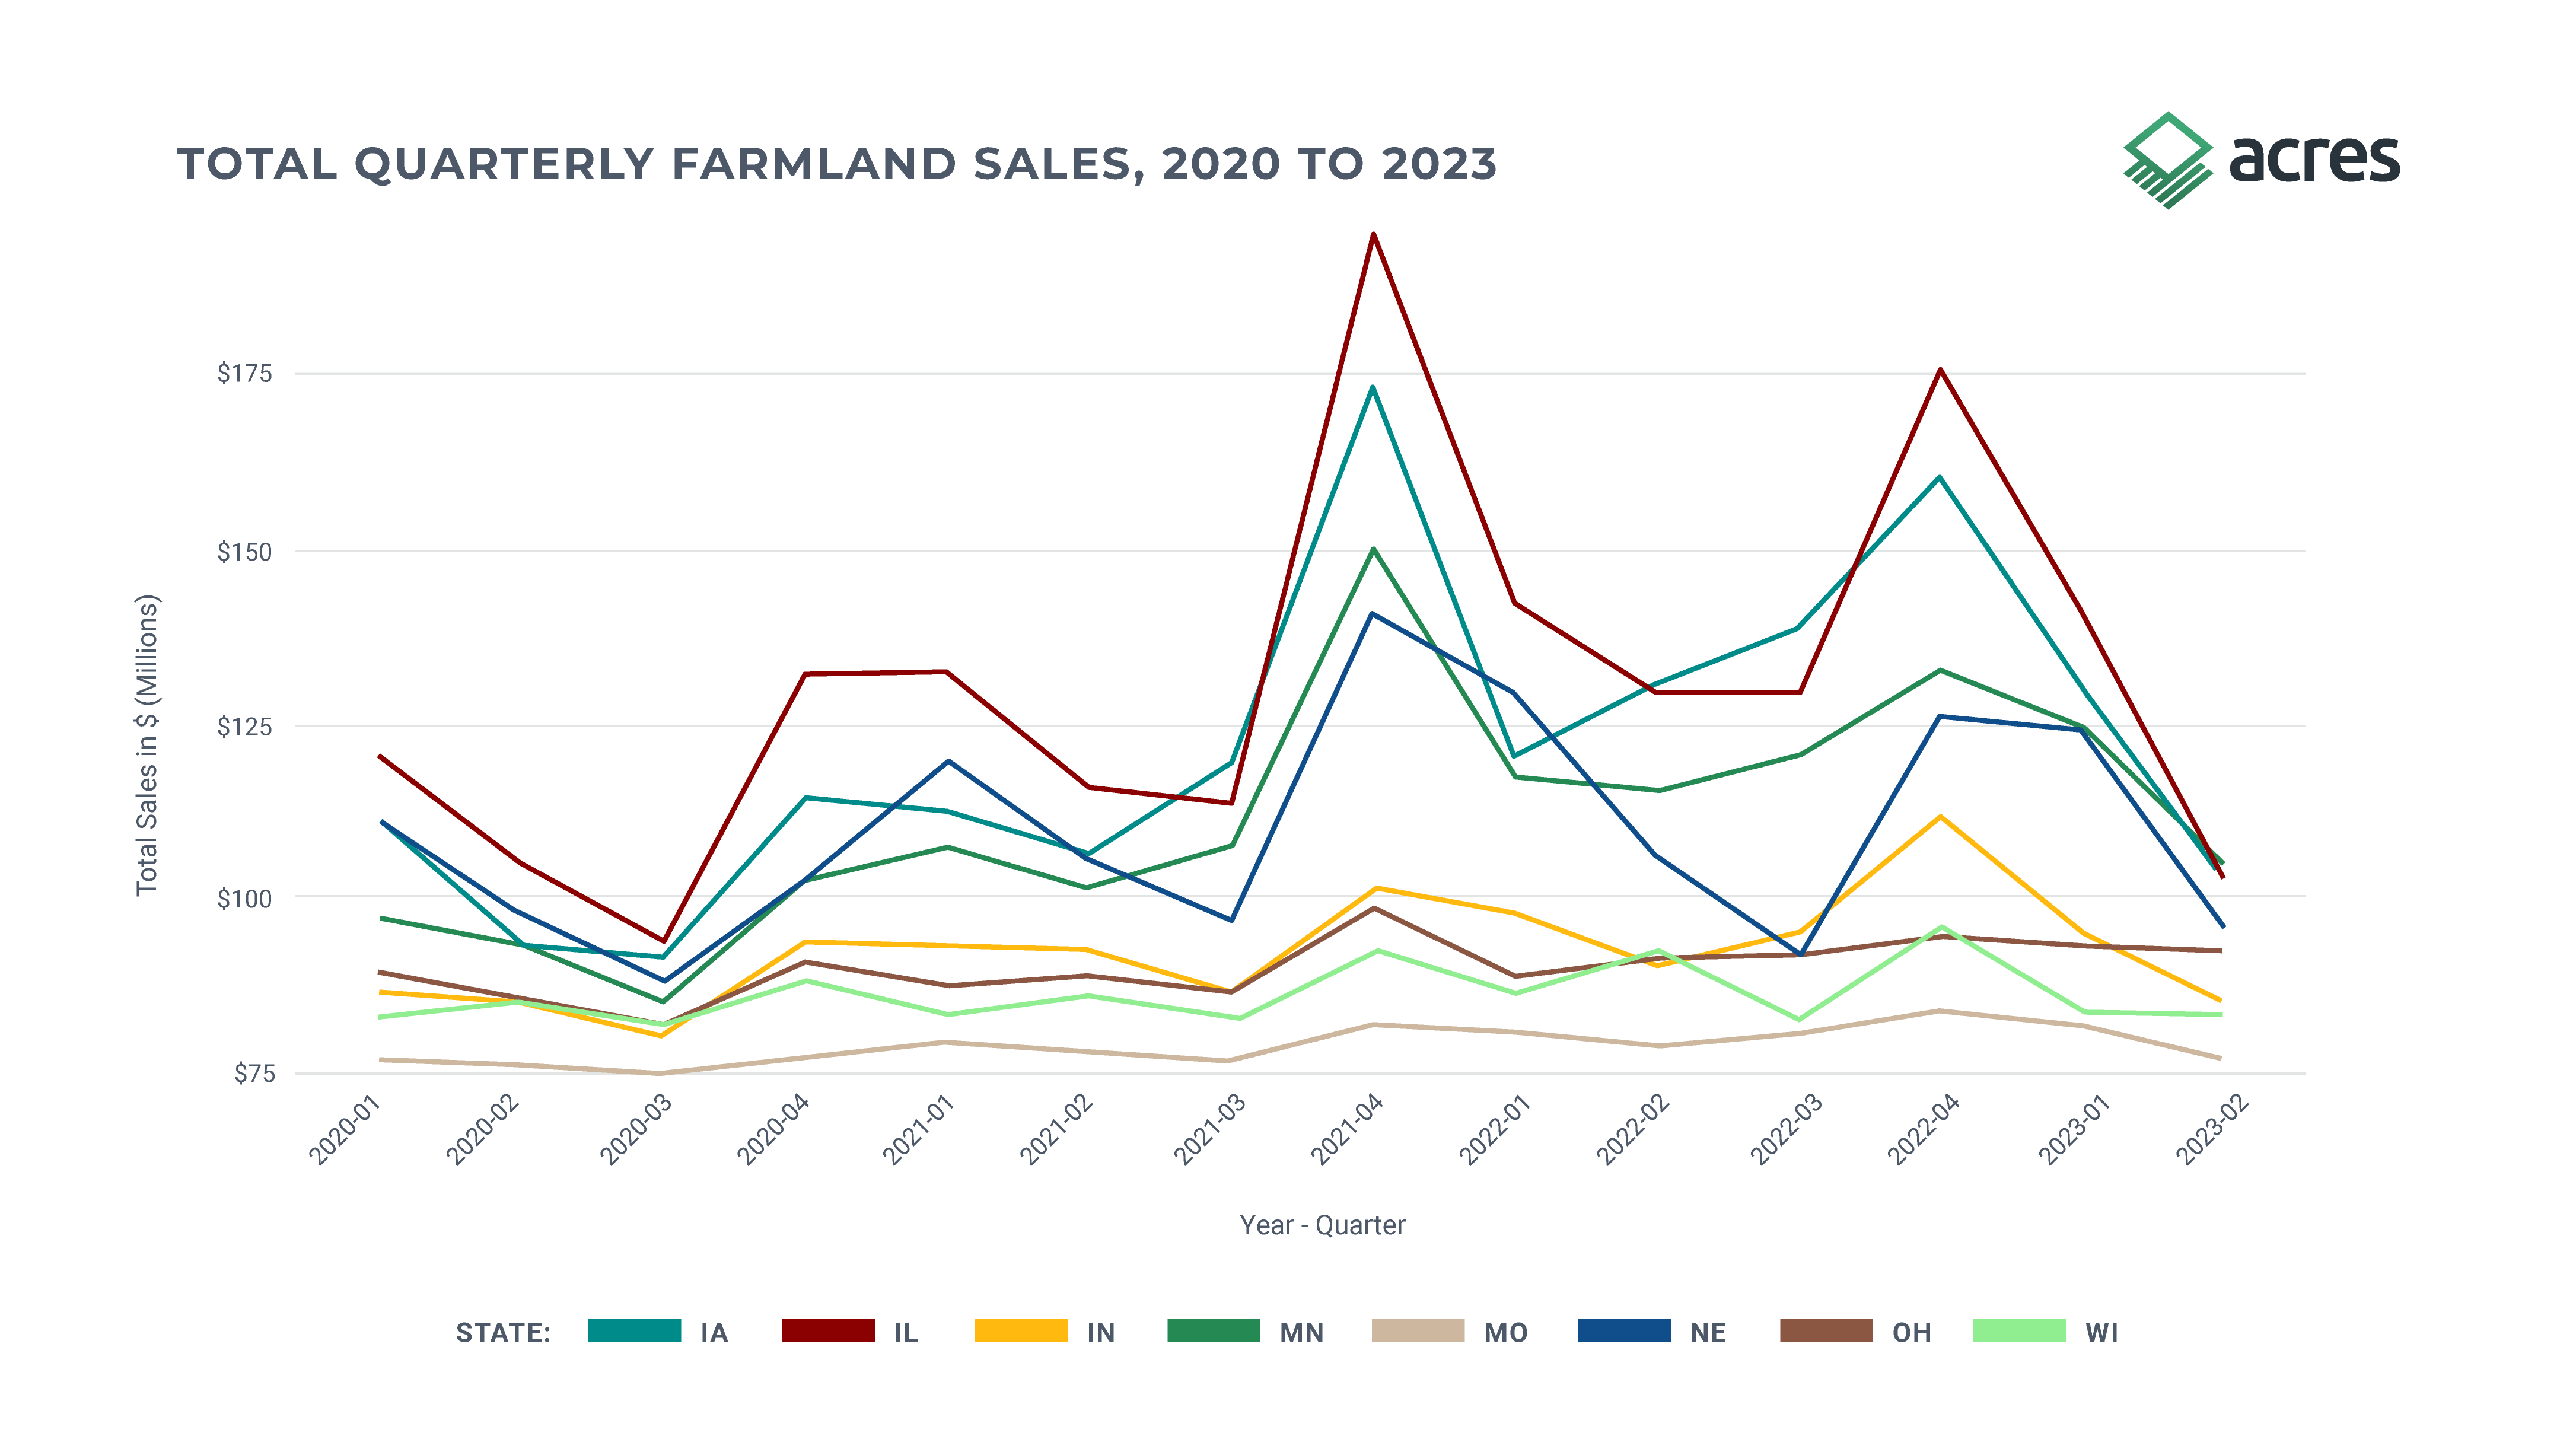
Note: These totals are only inclusive of the farmland sales we used throughout the report. The outliers that were removed would increase the numbers above.
Figure 6. State-wise Farmland Total Acres Sold by Quarter, 2020 - 2023.

Note: These totals are only inclusive of the farmland sales we used throughout the report. The outliers that were removed would increase the numbers above.
In Figure 7 below, we find robust market performance based on the average price per acre in crop reporting districts across the Heartland. To date in 2023, we see strong price per acre performance in Northwest Iowa and throughout Illinois.
The strongest farmland markets are centered in Illinois and Northwest Iowa as expected based on regional productivity and historical farmland values, while Northern Minnesota, Western Nebraska, and Southern Ohio are more tempered.
This is likely due to spatial variability in production characteristics in those regions relative to traditionally high performing areas. Central Missouri has had some notably and abnormally high sales in 2023 relative to historical sales, which is highlighted by the price per tillable acre averaging around $15,000 in the first half of the year.
Figure 7. shows a heat map of price per tillable acre across crop reporting districts in the Heartland.

We observed strong growth in percentage increases for farmland across the Heartland between 2020 and 2023. Central Illinois, Northern Nebraska, Central Missouri, and Southeast Ohio experienced several high sales in 2023, which shifted the percentage change abnormally even for a strong year of farmland sales. Parts of Ohio and Northeast Minnesota saw few sales and very little growth compared to other areas in the Heartland region.
Figure 8. illustrates the percentage increase in farmland values from average price per tillable acre in 2020 to average price per tillable acre in 2023.

Our analysis of farmland value trends is grounded in a combination of decades of rigorous data science, expertise in farmland investments, and farm real estate. Valuing farmland is intricate, given the variable quality of data as well as the highly idiosyncratic nature of farmland sales. It often takes considerable time and experience to accurately assess the market, especially when adjusting for outliers in sale prices. Moreover, collating and refining data on tillable acreage and productivity from varied sources is essential for meaningful valuations at local and regional scales.
While we provide a comprehensive overview of farmland values using the Acres sales database, we encourage and empower independent exploration of farmland sales and market analysis on Acres.com. Local farmland markets have their own distinct characteristics, and there's no one-size-fits-all analysis.
In other words, analyzing farmland markets is both an art and science - requiring professionals to have a deep understanding of regional market dynamics as well as high quality sales data for deep analysis of productivity and topography. Users of Acres.com have these tools readily available to conduct their own detailed farmland valuations and market assessments based on their expertise.
For a more granular look at market trends, particularly state-by-state comparisons emphasizing productivity classes, download the full report here.
Heartland farmland values explained by industry experts. Get key findings from the Heartland Report and watch the full conversation.
Soil indices unlock insights into farmland productivity and property values. Learn the basics about US soil scores, like NCCPI, WAPI, CSR2, PI, and...
Todd Kuethe of Purdue University meets with Acres’ Aaron Shew to discuss the future of farmland valuation through collaborative data and research.
