Trends
Heartland Farmland Values: Key Findings from Our Report
Heartland farmland values explained by industry experts. Get key findings from the Heartland Report and watch the full conversation.
Soil indices unlock insights into farmland productivity and property values. Learn the basics about US soil scores, like NCCPI, WAPI, CSR2, PI, and CPI.
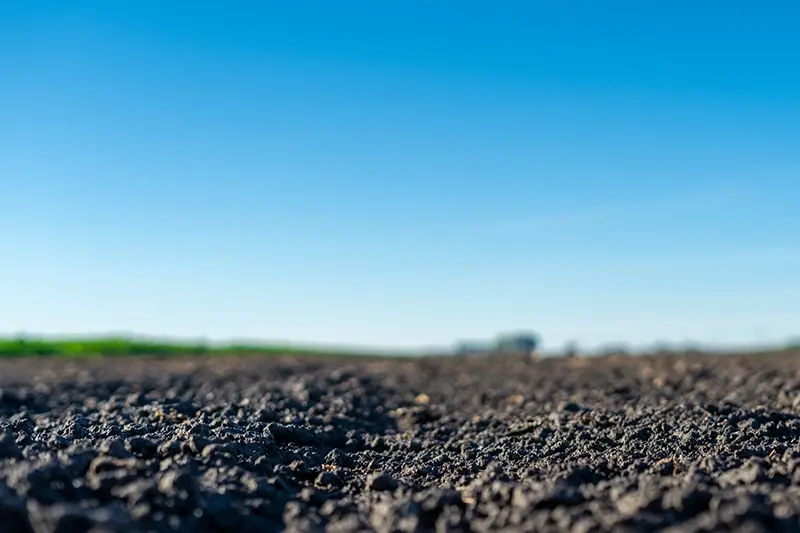

Soil indices are powerful tools that unlock insights into farmland productivity and its consequent impact on property value. Understanding these indices can lead to optimized farming techniques and informed land investment decisions, benefiting farmers, land brokers, and first-time landowners. This guide offers a thorough exploration of NCCPI, WAPI, CSR2, PI, and CPI, common soil productivity indices which are all available for free on Acres.
Understanding Soil Scores: Assumptions and Limitations
National Commodity Crop Productivity Index (NCCPI)
Weighted Average Productivity Index (WAPI)
Corn Suitability Rating 2 (CSR2)
Before delving into the details of these productivity index systems, it’s important to understand what soil scores take into account as well as some limitations of these systems.
Soil scores or indices offer useful approximations of the productivity potential of land. They typically assume that the land has been reasonably well managed and is free from environmental constraints that could significantly inhibit crop growth. These scores are generally derived from various soil characteristics such as texture, slope, organic matter content, pH level, and more, alongside climate data where relevant. Soil scores may include or omit these factors regionally or across states based on decisions made by experts at the USDA Natural Resources Conservation Service.
However, while these scores are invaluable tools, it's crucial to understand what they don't take into account. Most soil scores don't fully consider the impact of land management practices, which can substantially alter soil health over time. Practices such as crop rotation, cover cropping, and conservation tillage can improve soil health, while excessive tillage or poor nutrient management can degrade it.
Soil scores typically don't account for other constraints that might limit productivity. These can include issues such as pest pressures, disease prevalence, availability and quality of irrigation water, access to markets, or local agricultural policies.
In essence, while soil scores provide a standardized way to assess and compare the relative productivity of soils, they should be used alongside other considerations when making decisions about land management or investment. You can also have a soil test conducted on a property before purchasing to dig deeper into the current health of the soil.
The NCCPI serves as a standard for comparing soil productivity nationwide. Designed to evaluate soil suitability for major commodity crops such as corn and soy, this index can significantly influence farmland values. It takes into account soil properties, topography, and climatic data, providing a holistic view of unirrigated crop potential. The overall aim of the NCCPI is to provide a relative metric for assessing crop productivity across regions.
While NCCPI is instrumental in farmland evaluation, it's essential to consider other factors such as historic land use and regional considerations, which may affect soil quality and are not factored into this national system. It is also not intended to replace state-specific productivity indexes like CSR2 or PI.
The Weighted Average Productivity Index, commonly known as WAPI, is a distinct soil productivity index primarily used in Indiana. It's designed to calculate soil productivity by factoring in a variety of soil characteristics and weighing them according to their influence on unirrigated corn yields. Unlike other productivity indices, WAPI is somewhat of a misnomer because it is measured in expected corn yields in bushels per acre rather than converted to a relative index between 0 and 100.
WAPI evaluates a range of soil attributes such as organic matter content, drainage capability, and depth. Organic matter content refers to the amount of decomposed plant and animal matter present in the soil, which can significantly enhance soil fertility. The drainage capability of the soil, or its ability to drain excess water, is critical in maintaining optimal moisture levels for plant growth. Depth refers to the thickness of the topsoil layer, which often houses essential nutrients for crops.
The index provides a productivity score, which assists farmers and land investors in understanding the potential yield of their land better. The WAPI scale range can vary with each annual release of the NRCS soils database because unlike NCCPI it’s measured in expected bushels per acre (bu/acre) for corn for each combination of soil characteristics. WAPI typically ranges between 0 and 200 bu/acre, where 0 represents land with very little to no corn productivity, and 200 signifies soil with the highest productivity potential for corn.
The Corn Suitability Rating 2, or CSR2, is an index widely employed in Iowa as a measure of soil productivity. As an updated version of the original CSR, CSR2 integrates advancements in digital soil mapping and climate data to offer a more accurate, contemporary understanding of soil productivity.
Digital soil mapping, in this context, refers to the use of computer algorithms and databases to predict the distribution of soil properties across the landscape. Climate data includes regional information about historical temperature, rainfall, humidity, wind, and other weather conditions, all of which significantly influence crop yields.
Iowa State University developed CSR2 and introduced an important update in 2013, leading to the "2" in the name. This index operates on a scale of 5 to 100, with 5 indicating the least productive soil and 100 representing the most fertile soil.
A unique aspect of CSR2 is its role in land valuation in Iowa. In some cases, land values are expressed as a price per CSR2 point, which serves as a helpful metric for land buyers and sellers to evaluate property worth in terms of expected productivity. Therefore, not only does CSR2 provide valuable information for soil management and optimization, but it also has a direct impact on land economics in the region.
The Illinois Productivity Index, often referred to solely as PI by regional experts, is a widely used soil productivity metric in Illinois. This index evaluates soil productivity by considering a range of factors that directly influence crop yields.
PI integrates measurements of water-holding capacity, organic matter content, and pH levels and assumes an optimum level of land management to estimate potential crop productivity. Importantly, the Illinois PI is weighted by an erodibility factor for each soil type to account for the influence of topography on expected productivity.
Water-holding capacity is the measure of how well the soil can retain water for crop use, which directly affects crop yields, particularly during dry periods on unirrigated land. Organic matter content contributes to soil fertility by adding essential nutrients and improving soil structure and water-holding capacity. Soil pH levels influence the availability of nutrients to the plants, with different crops having specific optimal pH ranges.
The PI ranges from 47 to 147. Land with a PI score over 100 is considered farmable agricultural land, which means it is suitable for producing economically viable crops. In addition, PI scores are further categorized into soil classes A through C, with class A soils having the highest productivity.
This comprehensive index was developed by the University of Illinois and continues to provide indispensable insights into soil fertility and the potential productivity of various crops.
The Crop Productivity Index, or CPI, is a specific soil productivity metric predominantly employed in Minnesota as well as North and South Dakota. The CPI varies slightly across MN, ND, and SD based on measures of potential soil productivity for a variety of crops, including corn, soybeans, and wheat.
CPI ratings are based on soil properties, such as organic matter content or reaction (pH), and hazards, like flooding. Climatic factors, irrigation, artificial drainage, land leveling and terracing, and poor land management are not taken into account.
Scores in CPI range from 0 to 100, with 0 indicating soils with least productivity and 100 representing the most fertile soils. This wide range allows farmers and landowners to accurately assess soil fertility and potential crop yields, thereby guiding their farming decisions or land investments.
Different crops may require slightly different soil conditions, but there are several common characteristics of healthy soil.
An understanding of soil productivity indices is not just a boon to agricultural practices; it plays a significant role in discerning the intrinsic value of the land. Each index, with its unique characteristics and applications across regions, offers insights into the land's fertility and, by extension, its potential productivity. These attributes directly impact the value of the farmland, making these indices indispensable tools for land investors, brokers, and farmers alike.
Whether you're contemplating a land investment, planning a crop strategy, or assessing the value of existing farmland, these systems can offer an enhanced understanding of the land's productivity, directly impacting its economic worth and return on investment. Check out Acres’ soil layer for insights into soil type, productivity index score, and more for parcels nationwide.
Heartland farmland values explained by industry experts. Get key findings from the Heartland Report and watch the full conversation.
Todd Kuethe of Purdue University meets with Acres’ Aaron Shew to discuss the future of farmland valuation through collaborative data and research.
Explore transaction-based insights on farmland values and trends across the Midwest Heartland region between Q1 of 2020 and Q2 of 2023.
