When it comes to researching land—whether for agriculture, investment, conservation, or development—the devil is in the details. With Acres’ parcel-level Insights, you have powerful tools at your fingertips to analyze land with precision, clarity, and confidence. This guide walks you through seven critical insights you can use to evaluate a property on Acres.com.
1. Historic Satellite Imagery: See How the Land Was Used
Acres’ historic satellite imagery lets you visually explore how a property has been used over time. By sliding through year-by-year images, you can uncover patterns that reveal the land’s operational history.
- See when fields were actively farmed, left fallow, or converted for other uses.
- Identify past infrastructure changes like the addition of irrigation systems, access roads, or cleared timber.
- Spot signs of erosion, flood damage, or encroachment from nearby development.
This tool gives you a reliable, visual record of land use—helping you validate claims, detect trends, and make informed decisions grounded in real history.
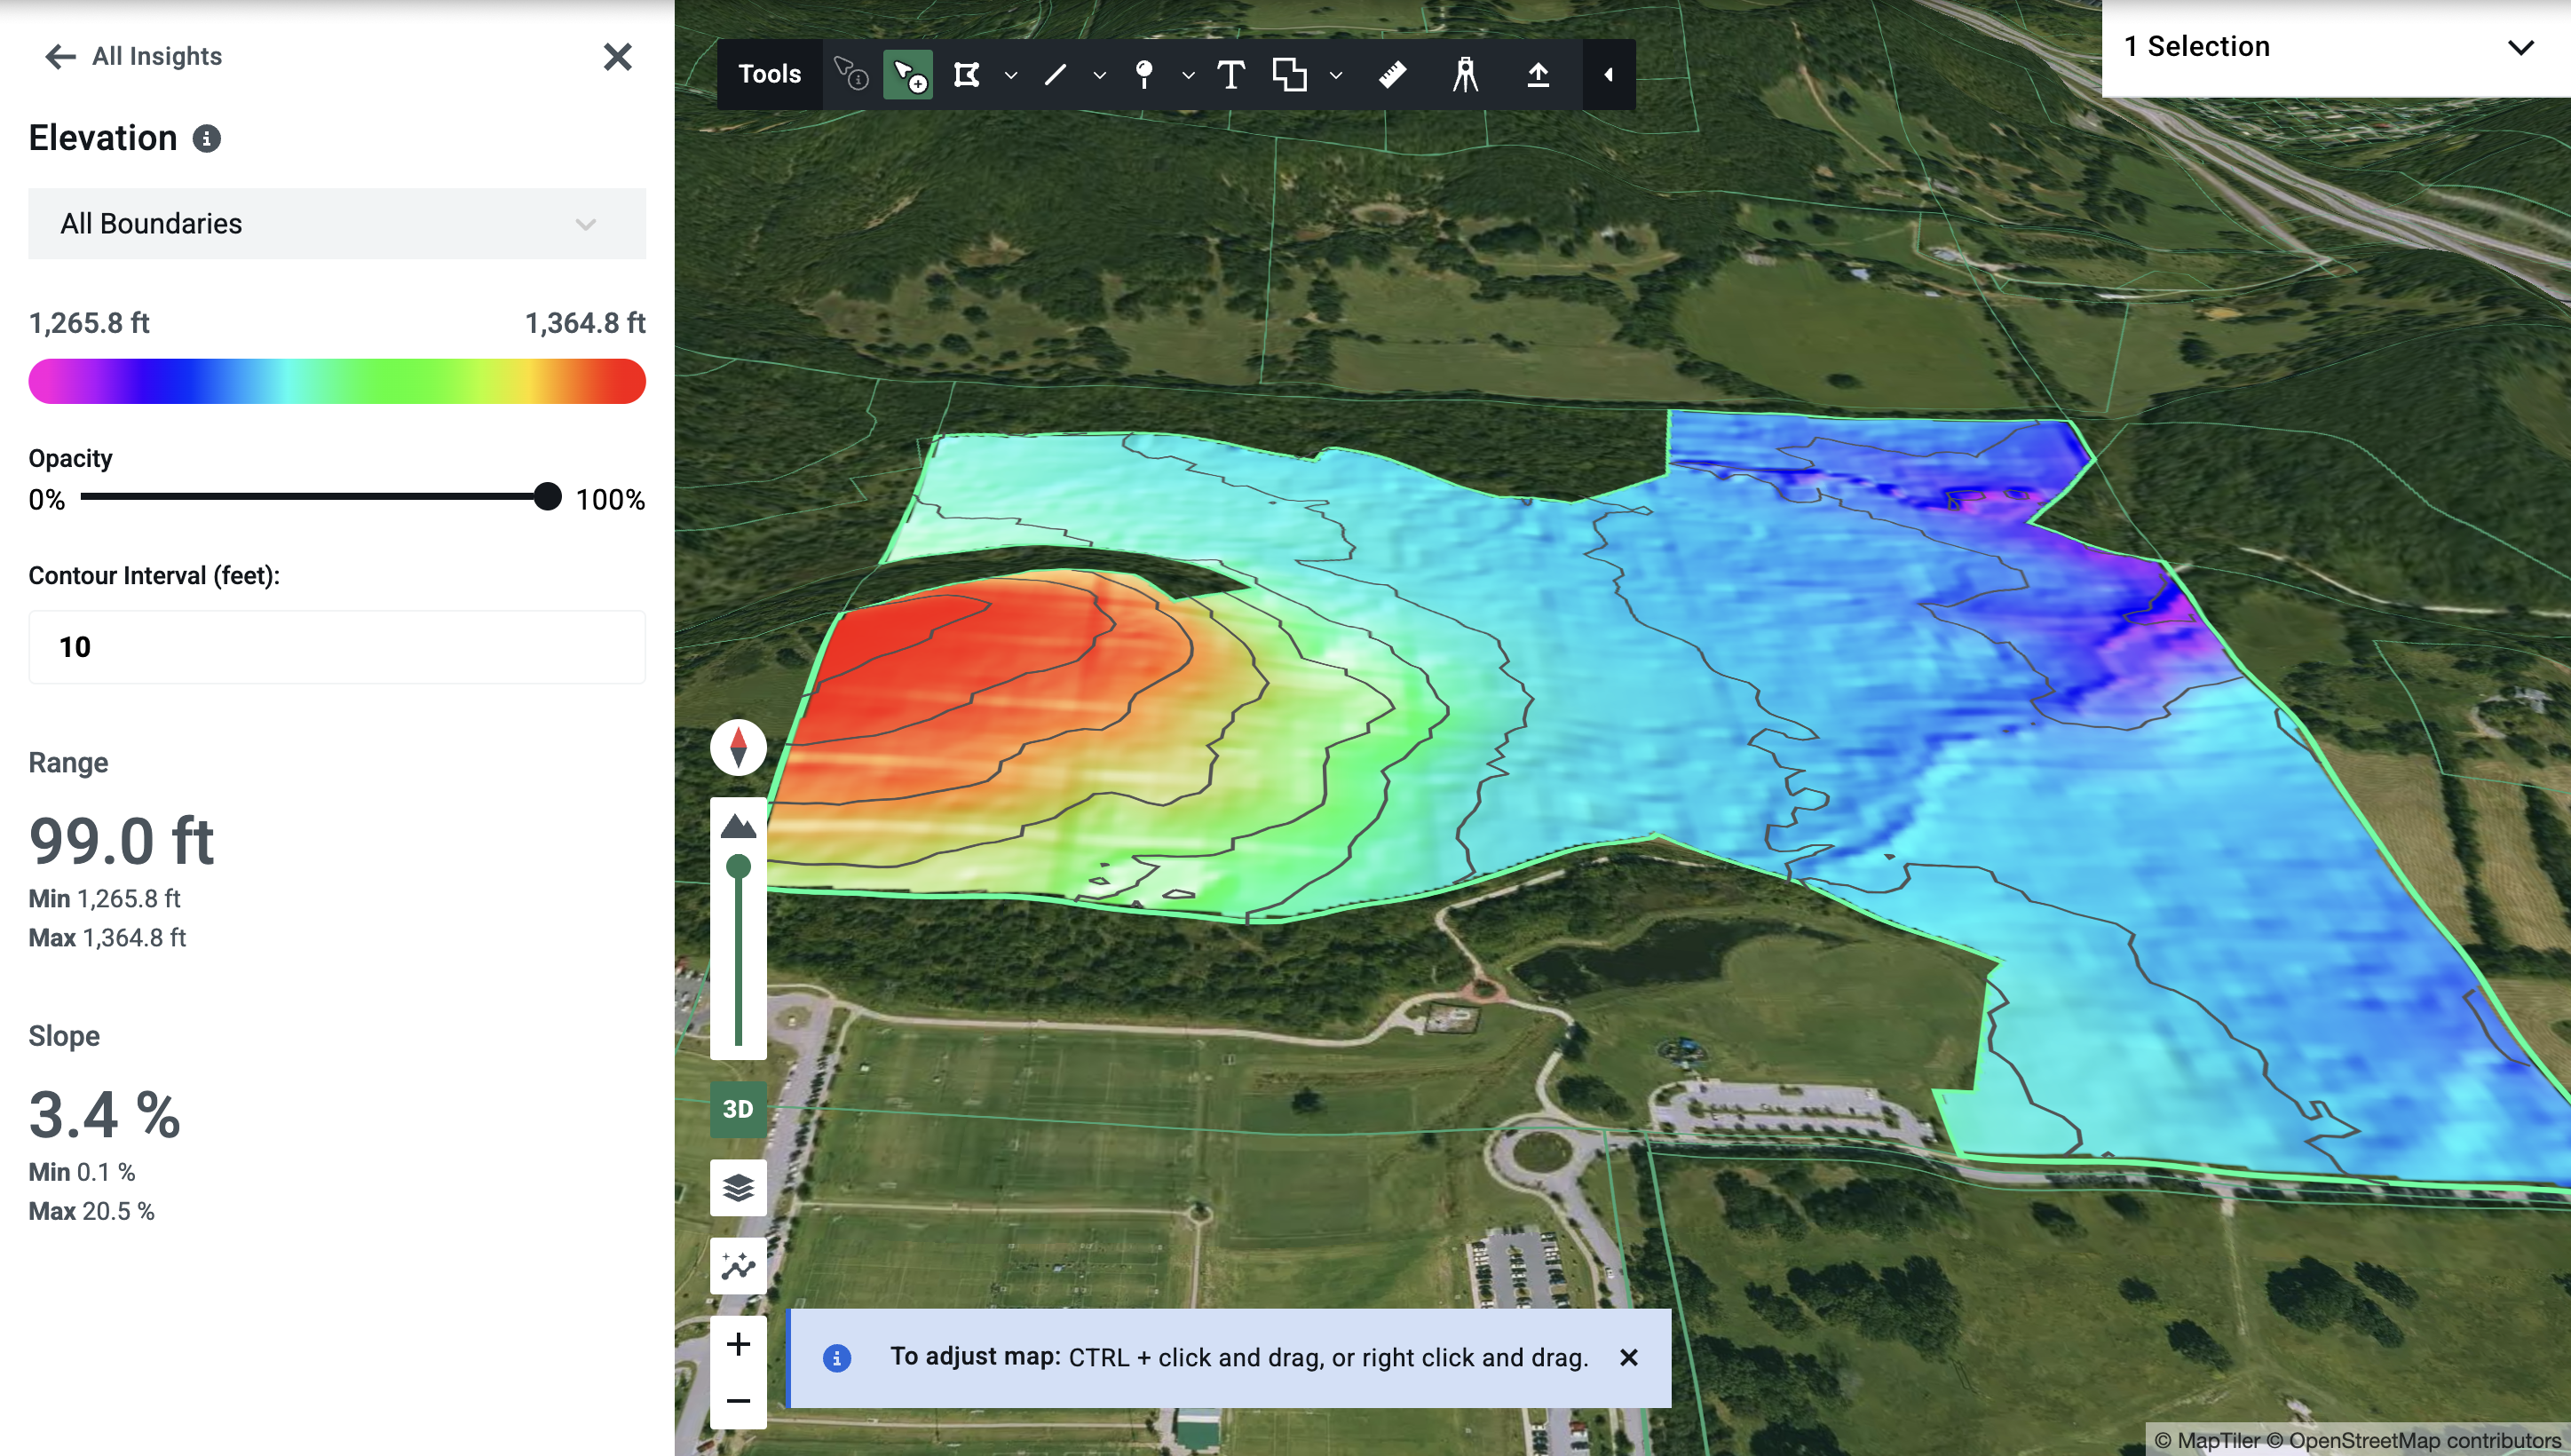
2. Elevation: Understand Topographic Context
Topography plays a vital role in water flow, crop suitability, construction feasibility, and even erosion risk. The Elevation layer allows you to:
- Visualize slope and elevation contours at the parcel level.
- Identify high and low points that may impact drainage or building plans.
- Assess suitability for row crops vs. orchard crops, or for infrastructure like roads and buildings.
3. Flood Risk: Evaluate Potential Water Hazards
Flooding risk can drastically affect land value, insurance, and land use. Acres provides FEMA-based Flood Risk and wetlands overlays:
- See if a property lies within a floodplain or wetlands.
- Identify areas where insurance requirements or land use restrictions may apply.
- Combine this with historic imagery to see if water pooling is evident over time.
4. Soils: Know the Foundation
Soil type is foundational to everything from crop productivity to septic viability. The Soils layer includes:
- Soil type breakdowns with soil codes, descriptions, soil scores, and non-IRR class.
- Percentage coverage for each soil type on the parcel.
- Valuable for farmers assessing yields, or developers evaluating foundation requirements.
5. Vegetation Index (NDVI): Monitor Health and Productivity
NDVI (Normalized Difference Vegetation Index) measures plant health using satellite imagery.
- Use the Vegetation Index layer to analyze photosynthetic activity across the parcel.
- Spot inconsistencies in vegetative health that might indicate soil issues, drainage problems, or field management practices.
- View changes over multiple growing seasons to detect trends in productivity.
6. Crop History: Reveal Past Usage
Want to know what was planted in a field before you buy? Acres aggregates USDA Crop Data Layer and California Natural Resource Agency records, so you can see:
- Year-by-year crop maps going back 10 years.
- Patterns in crop rotation, fallow years, or shifts from row crops to specialty uses.
- Confirm whether land was used for corn, soybeans, wheat, cotton, or other crops.
7. Property Tax Data: Track Year-over-Year Tax Amounts
The Property Tax layer on Acres allows you to see how annual property tax bills have changed for a parcel over time. While it doesn’t include assessed values or ownership details, this timeline view offers a direct look at how the tax burden has fluctuated year by year.
- View the actual tax amount paid for each year available.
- Spot significant increases or decreases that may indicate a change in land use, improvements, or reclassification.
It’s a quick way to assess financial patterns at the parcel level and raise questions about what may have changed on the land in a given year.
Final Thoughts
Each of these layers is powerful on its own, but the real strength of Acres Insights comes from their combined use:
- Flood + Soils + Elevation = Great for evaluating development risk.
- Crop History + NDVI + Soils = Perfect for understanding ag productivity.
- Historic Imagery + Crop History + Vegetation Index = A clear view into how land was used, managed, or improved over time.
With parcel-level access to satellite, government, and environmental data, Acres Intelligence puts robust land data into your back pocket—without needing a GIS degree.
Start your free trial today and explore land with confidence.