The best housing market indicators often arrive before the first shovel hits the ground. While permits, starts and completions tell you what's already happening, land acquisitions reveal where builders are placing their bets on future growth.
Using the Acres Home Builder Index, we analyzed 3,171 buyer-side land transactions totaling 14,152 acres and $1.17 billion across South Carolina's upstate Spartanburg Metro region from 2017 through 2025. The data spans nine counties: Anderson, Cherokee, Greenville, Greenwood, Laurens, Oconee, Pickens, Spartanburg and Union.
The trend is unmistakable. Pre-pandemic (2017–2019), builders acquired an average of 160 acres per quarter. Post-pandemic (2021–2024), that surged to 600 acres per quarter, nearly a 4x increase. Activity dipped briefly in late 2022 as interest rates climbed sharply, then rebounded, peaking in mid-2023. The pattern suggests builders front-loaded acquisitions as rate hikes loomed, paused to reassess, and resumed once the market stabilized.
.png?width=1783&height=1073&name=fig_annual_acres_branded%20(1).png)
Here's what else the land acquisitions tell us.
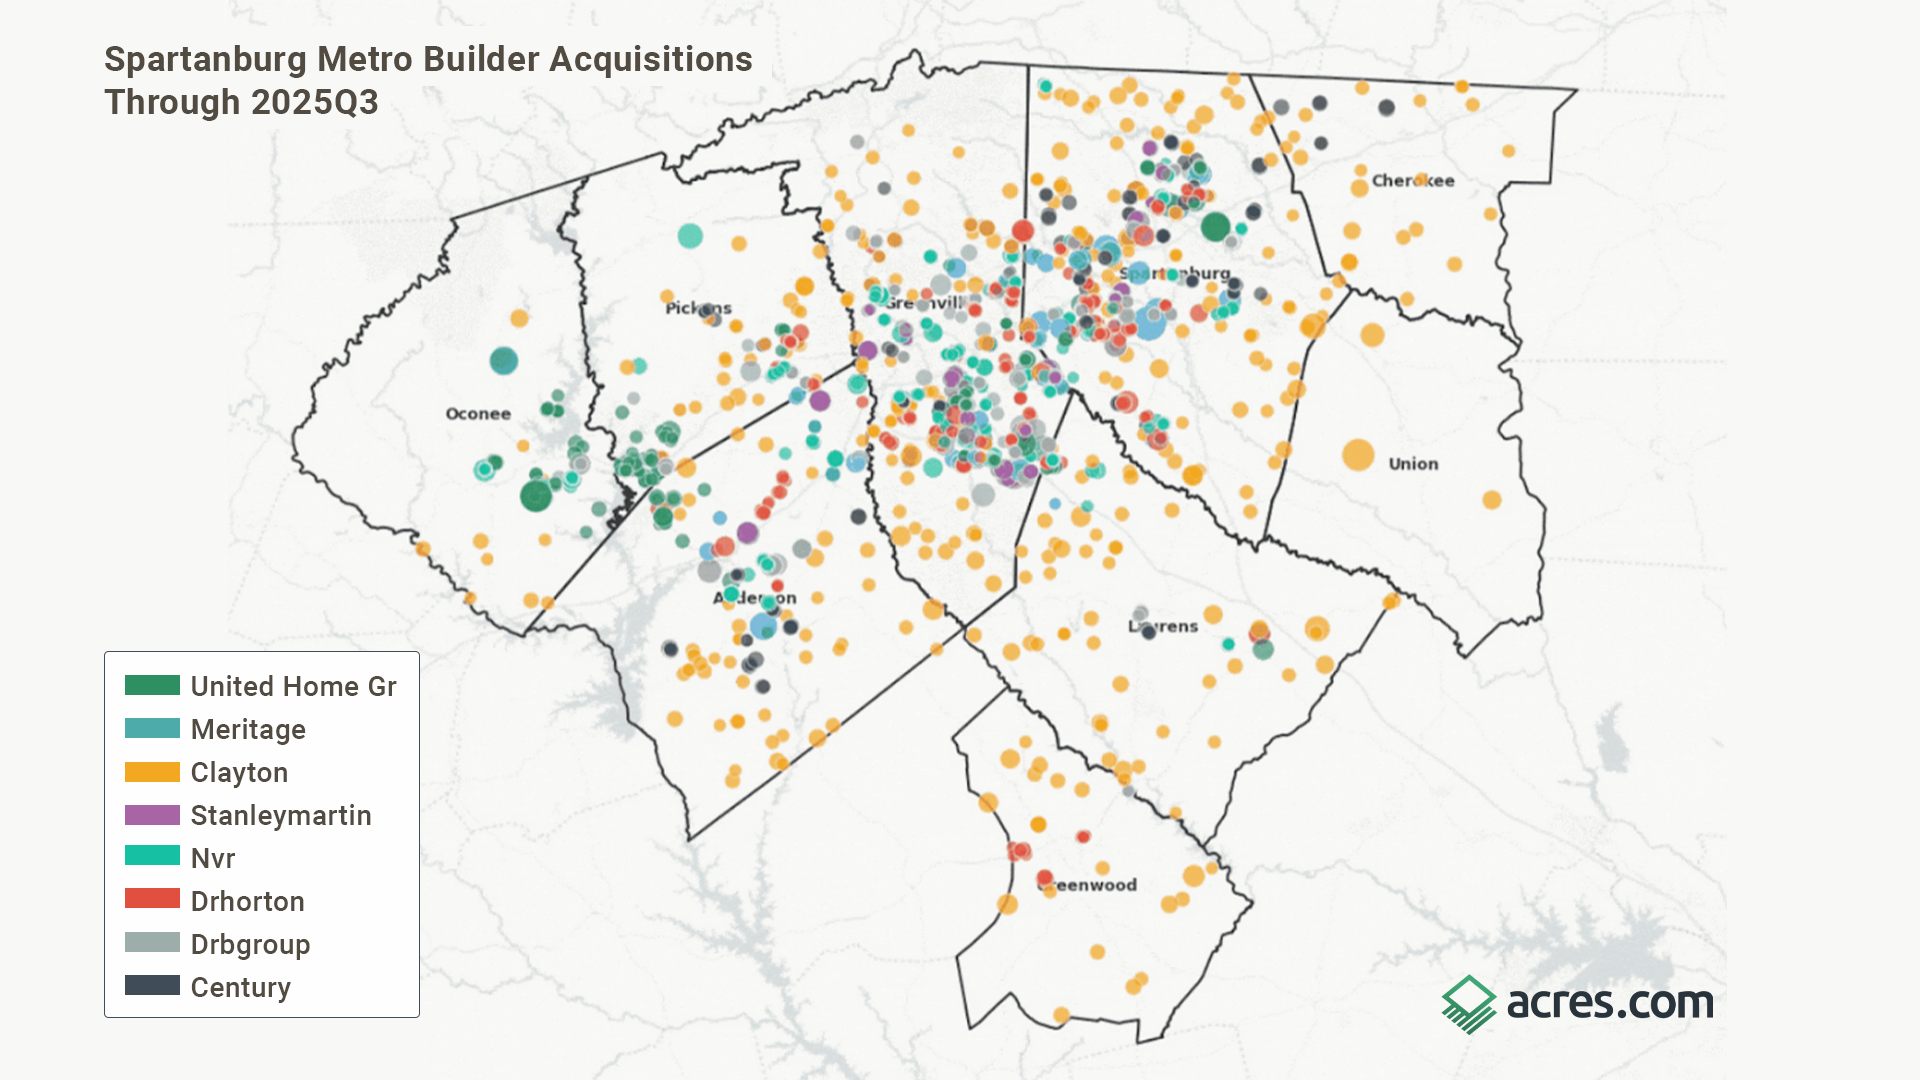
Three Counties Dominate the Signal
Not all counties are created equal when it comes to builder interest. Three markets account for nearly three-quarters of all acquired acreage:
- Spartanburg County: 3,917 acres (28%)
- Greenville County: 3,348 acres (24%)
- Oconee County: 3,221 acres (23%)
.gif?width=1476&height=1225&name=Untitled%20design%20(2).gif)
Together, these three counties represent 74% of total builder acquisitions in the metro bundle.
Interestingly, Greenville and Spartanburg lead in transaction count (1,020 and 984 deals respectively), while Oconee ranks third in acreage with only 193 transactions. That implies builders are acquiring larger tracts in Oconee—potentially signaling master-planned community development rather than infill activity.

At the other end of the spectrum, Cherokee, Greenwood and Union counties combined account for just 793 acres (6%)—suggesting these markets haven't yet attracted significant builder attention.
Who’s Leading the Market?
The buyer landscape is concentrated at the top. Just three entities account for more than half of all acquired acreage:
- United Homes Group: 3,846 acres (27%)
- Meritage Homes: 2,116 acres (15%)
- Clayton Homes: 1,999 acres (14%)

Other national builders maintain meaningful positions. NVR, D.R. Horton and Stanley Martin all appear in the top ten, but the dominance of United Homes and Meritage is unmistakable.
The biggest individual deal in the dataset: a $27.0 million acquisition of 288.76 acres in Oconee County by United Homes Group (operating as Great Southern Homes) in May 2025. Deals of this scale typically foreshadow major subdivision development years before any homes hit the market.
What Attracts Builders to Certain Counties
Land transactions don't happen in a vacuum. We tested whether county-level fundamentals—infrastructure, jobs, and commuter patterns—line up with builder activity.
The results are clear: Counties with better broadband infrastructure and more jobs see significantly more builder acquisitions.
This makes intuitive sense: Builders are following the infrastructure that new homeowners will demand (fast internet) and the economic activity that sustains housing demand (jobs).
.png?width=1486&height=1074&name=fig_scatter_fiber_branded%20(1).png)
When we looked at how this pattern holds up over time, we found that location matters more than timing. Builders pick which counties to enter based on long-term fundamentals, then acquire land opportunistically.
.png?width=1486&height=1074&name=fig_scatter_commute_branded%20(1).png)
Year-to-year economic swings don't seem to change where they're buying—they've already made the location decision.
.png?width=1475&height=1074&name=fig_scatter_jobs_branded%20(1).png)
Not All Builders Follow the Same Playbook
Here's where it gets interesting: Not every builder is chasing the same counties.
We scored each builder by the characteristics of the counties where they've acquired land. A high score means the builder concentrates in high-infrastructure, high-jobs counties. A low score means they're targeting opportunity markets—places where fundamentals are weaker today but may improve.
Infrastructure-focused builders:
- Dreamfinders: Heavily concentrated in Greenville, averaging 60% fiber coverage and 241K jobs in their target counties.
- Lennar: Similar profile—focused on established, high-infrastructure markets.
- D.R. Horton: Tilts toward infrastructure, but more diversified.
Opportunity-focused builders:
- Clayton: Acquiring in counties averaging just 42% fiber and 68K jobs—betting on future growth.
- United Homes Group: Despite being the largest acquirer by acreage, they're concentrated in lower-fundamental counties like Oconee.
- Century: Similar pattern—finding value before infrastructure arrives.
.png?width=1484&height=1072&name=fig_builder_strategy_branded%20(1).png)
This split suggests two distinct strategies at work. Some builders follow the infrastructure; others get ahead of it. The largest single deal in an emerging-market county: Clayton's 301-acre acquisition in Union County, where fiber coverage sits at just 29%.
Where Are Builders Overlooking Opportunity Areas?
Here's where the analysis gets actionable.
We predicted how many acres should be acquired in each county based on its fundamentals (fiber coverage, jobs, commuter inflows). Comparing actual acquisitions to expectations reveals which counties are over—or underperforming:
Overperformers (more acquisitions than expected):
- Oconee: Nearly 1,900 acres above predicted
- Spartanburg: About 1,100 acres above predicted
Underperformers (fewer acquisitions than expected):
- Pickens: Around 1,400 acres below predicted
- Greenwood: Almost 900 acres below predicted
- Cherokee: About 650 acres below predicted
Why are some counties underperforming? We tested whether land cost explains the gap, and it doesn’t. There's no meaningful relationship between land prices and whether builders are active in a county.
Something else is keeping builders out—entitlements, topography, water infrastructure or another factor—is at play.
This creates an opportunity map.
.png?width=1486&height=1222&name=fig_opportunity_quadrant_final%20(1).png)
Cherokee and Greenwood emerge as the most underutilized counties—with decent fundamentals and below-median land costs.
If builders expand beyond the core, these counties may be next.
What the Spartanburg Data Makes Clear
Across the Spartanburg Metro bundle, the data points to a three-county core (Spartanburg, Greenville, Oconee) where a handful of large builders control most acquired acreage.
- Counties with better broadband and more jobs see more acquisitions—builders follow infrastructure and economic activity.
- Not all builders follow the same playbook. Dreamfinders and Lennar chase established infrastructure; Clayton and United Homes bet on opportunity counties before infrastructure arrives.
- Cherokee and Greenwood are underperforming their fundamentals with below-median land costs—potential targets for builders not yet in those markets.
Builders pick counties based on structural advantages, but their strategies diverge. Some follow the infrastructure; others get ahead of it. The counties with good fundamentals that remain underweight—that's where the next wave may land.
Get Access to Future-State Land Intel
The Acres Home Builder Index helps teams spot builder activity early, compare county momentum and track what changed since the last release.
Monitor transactions, parcel footprints and emerging growth corridors before the market catches on.
Data sources: Acres Home Builder Index (2017–2025), FCC National Broadband Map (2024), Census LEHD LODES (2021), BLS LAUS (2019–2023), Census ACS 5-year estimates, Zillow ZHVI (2025), USDA NASS land values (2023), Census TIGER county boundaries (2023).
Extended citations
Population (ACS 5-year)
Source: U.S. Census Bureau, American Community Survey 5-year estimates
API: https://api.census.gov/data/{year}/acs/acs5
Variable: B01003_001E (Total population)
Years used: [2019, 2020, 2021, 2022, 2023]
Building permits (Census BPS)
Source: U.S. Census Bureau, Building Permits Survey (county files)
Files: https://www2.census.gov/econ/bps/County/co{YY}12y.txt
Interpreted as: December year-to-date (annual total) permit units by structure size
Years used: [2020, 2021, 2022, 2023, 2024]
Jobs (BLS LAUS)
Source: U.S. Bureau of Labor Statistics, Local Area Unemployment Statistics (county series)
API: https://api.bls.gov/publicAPI/v2/timeseries/data/
Series pattern (county): LAUCN{state_fips}{county_fips}0000000{measure3}
Measures used:
- 003 = unemployment rate
- 005 = employment level
Years used (annual mean of monthly values): [2020, 2021, 2022, 2023, 2024]
Broadband availability (FCC BDC)
Source: Federal Communications Commission, Broadband Data Collection (BDC)
Portal: https://broadbandmap.fcc.gov/data-download/nationwide-data
Data used: Fixed Broadband Summary by Geography Type (county level)
Metrics: % locations with fiber, % locations with 100/20 Mbps or faster
Vintage: June 2023 (Form 477 estimates where BDC API unavailable)
Note: FCC BDC API did not return direct data; estimates derived from Form 477 summary
Pipelines/utilities (OpenStreetMap)
Source: OpenStreetMap contributors
API: Overpass API (https://overpass-api.de/api/interpreter)
Query: `way["man_made"="pipeline"]` and `way["pipeline"]` within bounding box
Derived metric: Pipeline density (km of pipeline per sq km of county)
Vintage: Current snapshot (retrieved 2025-12-31)
Note: OSM is community-contributed and may not reflect complete infrastructure; no time series available
Commute patterns (LEHD LODES)
Source: U.S. Census Bureau, Longitudinal Employer-Household Dynamics (LEHD)
Data: LODES Origin-Destination Employment Statistics (OD)
Files: https://lehd.ces.census.gov/data/lodes/LODES8/sc/od/sc_od_main_JT00_{year}.csv.gz
JT00 = all jobs (primary and secondary)
Metrics:
- Jobs in county (workplace-based employment)
- Residents working (residence-based workers)
- Net inflow (jobs - residents)
- Inflow ratio (jobs / residents)
Years used: 2019, 2020, 2021 (aggregated to county level from block-level OD pairs)
Note: LODES data lags ~3 years; 2021 is the most recent available
Median household income (ACS 5-year)
Source: U.S. Census Bureau, American Community Survey 5-year estimates
API: https://api.census.gov/data/{year}/acs/acs5
Variable: B19013_001E (Median household income in the past 12 months, in inflation-adjusted dollars)
Years used: 2019, 2020, 2021, 2022, 2023
Vintage: Each year's 5-year estimate (e.g., 2023 = 2019-2023 average)
Housing price index (FHFA HPI)
Source: Federal Housing Finance Agency, House Price Index (all-transactions)
Portal: https://www.fhfa.gov/DataTools/Downloads/Pages/House-Price-Index-Datasets.aspx
Data: County-level all-transactions HPI (annual)
Index base: 1995 Q1 = 100
Years used: 2017–2024
Note: FHFA server was temporarily unavailable; estimated values derived from Zillow ZHVI trends for SC counties
Farmland values (USDA NASS)
Source: U.S. Department of Agriculture, National Agricultural Statistics Service
Portal: https://quickstats.nass.usda.gov/
Data: Land Values, all farmland ($/acre), county level
Years used: 2023 (estimated)
Note: USDA API required authentication; estimates derived from NASS SC land values reports
Home values (Zillow ZHVI)
Source: Zillow Research
Portal: https://www.zillow.com/research/data/
File: County_zhvi_uc_sfrcondo_tier_0.33_0.67_sm_sa_month.csv
Data: Zillow Home Value Index (ZHVI), all homes, smoothed, seasonally adjusted
Vintage: November 2025
Direct download: Real Zillow data successfully retrieved