Absorption rate in land markets is the percentage of available parcels or lots that sell within a defined period—typically expressed monthly. It measures the pace at which the market is consuming available land supply, and it is the most direct indicator of whether a given submarket favors buyers or sellers at any point in time.
For homebuilders evaluating lot supply in a target market, absorption rate is the metric that answers the most important question before a land acquisition: “How fast is this submarket moving?” A market with a high absorption rate tells a builder that buyers are there and inventory is tightening. A market with a falling absorption rate tells them to slow down and verify whether demand has softened or supply has surged.
Acres.com tracks parcel-level transaction data across over 150 million U.S. parcels, giving builders and buyers the transaction velocity signals behind any target geography before committing capital.
Contents
Why Homebuilders Use Absorption Rate Before Land Buys
How Is Absorption Rate Calculated for Land and Lot Markets?
Absorption Rate Reference Benchmarks: Example Table
What Does a Falling Absorption Rate Tell a Homebuilder?
How Absorption Rate Differs in Raw Land vs. Finished Lot Markets
Absorption Rate vs Days on Market
How Acres Surfaces Signals for Homebuilder Land Teams
Why Homebuilders Use Absorption Rate Before Land Buys, Not After
Buyers might encounter absorption rate after a transaction, when they are trying to understand why a deal took longer than expected or why a market that looked strong a year ago has slowed. Homebuilders who understand it correctly flip that sequence: they calculate absorption rate in a target submarket before they make an offer on land, because the rate tells them how much unsold inventory their new project will compete against and how long it will take to exit their investment.
Running an absorption rate analysis belongs at the top of the checklist before moving forward with a land acquisition. The challenge is that absorption rate is easy to calculate in theory and difficult to calculate accurately in practice. The data required (e.g. how many properties sold, how many were available at the start of the measurement period), is not always cleanly available from a single source, particularly for raw land and finished lot markets that do not always transact through MLS systems.
How Is Absorption Rate Calculated for Land and Lot Markets?
The standard formula divides the number of parcels or lots sold in a defined period by the number of active listings at the start of that period, then multiplies by 100 to express as a percentage. A market where 25 lots sold last month out of 100 available at the start of the month has a 25% monthly absorption rate. That same calculation expressed as months of supply—100 listings divided by 25 sales—gives 4 months of supply.
Months of supply is often more intuitive for land buyers than a percentage. A submarket with 4 months of supply means that if no new listings entered and sales continued at the current pace, available inventory would be exhausted in four months. Months of supply below six is generally interpreted as a seller's market with strong demand. Above six months, buyers have more negotiating leverage.
Absorption Rate Reference Benchmarks for Land and Lot Markets: Example Table
| Absorption Rate |
Months of Supply |
Market Condition |
What It Means for Homebuilders |
| Above 25% |
Under 4 months |
Strong seller's market |
High competition for lots; move fast on acquisition; lot prices rising |
| 15-25% |
4-6 months |
Balanced market |
Healthy demand; normal pricing; standard acquisition timeline viable |
| 10-15% |
6-9 months |
Softening market |
Watch for price concessions; verify demand drivers before committing |
| Below 10% |
9+ months |
Buyer's market |
Excess supply or weak demand; negotiate harder; reassess lot pricing model |
| Below 5% |
20+ months |
Distressed market |
Avoid new land commitments; focus on existing inventory management |
Note: Benchmarks in this table represent standard real estate industry thresholds and historical market guidelines. Local land and lot market conditions may vary based on geography, property type, and economic baselines.
The National Association of Realtors uses a 6-month supply benchmark as the dividing line between a buyer's and seller's market in residential real estate. In land and lot markets, the threshold works similarly, though the natural pace of land transactions is slower than for finished homes, so the interpretation of any given rate requires comparison against the local historical baseline rather than a national standard.
What Does a Falling Absorption Rate Tell a Homebuilder?
A falling absorption rate is more informative than a low one. A market that has been running at 12% absorption for three years is a known quantity: builders have priced that pace into their land acquisition models, their construction scheduling, and their sales velocity assumptions. A market that was running at 22% absorption eight months ago and is now at 11% is telling a very different story. It requires understanding the cause before any new land commitment is made.
An absorption rate above 20% is generally considered a seller's market signal, with homes or lots selling quickly and sellers typically holding pricing power. When a market transitions from above 20% to below 15% within a 12-month period, it warrants detailed investigation:
- Is new supply entering the market faster than demand is growing?
- Has an interest rate shift reduced qualified buyers in this price tier?
- Has a major employer reduced hiring or announced layoffs in the submarket?
The cause of a falling absorption rate determines the correct builder response. If the cause is a supply surge from competing new construction, the appropriate response is tighter lot pricing discipline and potentially a delay on new land acquisition until inventory clears. If the cause is a temporary demand shock from interest rate movement, the response may be waiting for rate stabilization before adjusting the acquisition pipeline.
Builders who identify the cause of an absorption rate change before it appears in price data have a meaningful advantage over those who wait for price cuts to confirm the signal. The rate moves before prices move, which is why tracking it quarterly, not annually, is the standard practice for leading land acquisition teams.
|
With Acres:
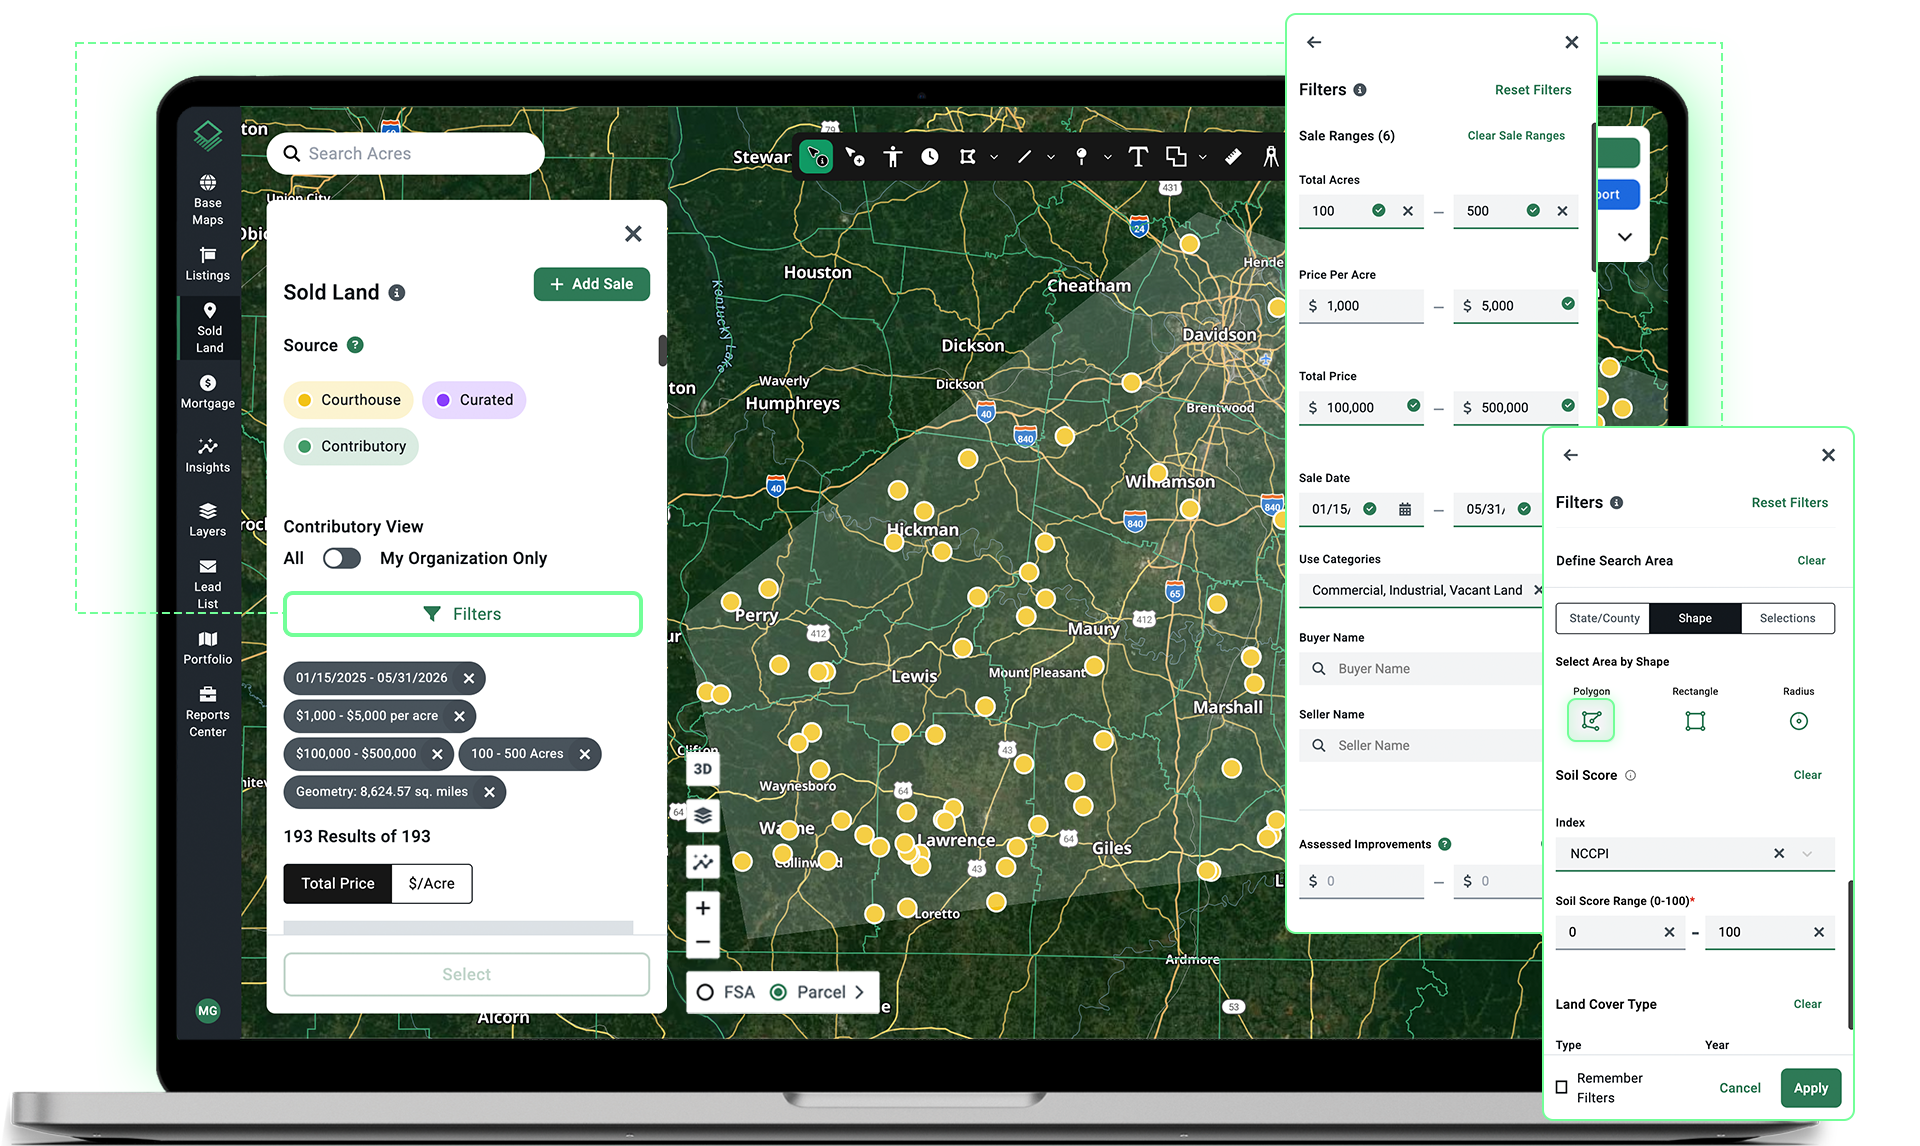
Acres surfaces parcel-level transaction data, including recent sales, current listings, and price per acre movement, across any U.S. geography. For homebuilder land teams running analysis on a target submarket, Acres provides the sales and transaction data for smarter acquisition decisions.
|
How Absorption Rate Differs in Raw Land vs. Finished Lot Markets
Homebuilders typically work with two distinct land market segments that have different absorption rate dynamics: raw land (pre-entitled acreage that requires development), and finished lots (permitted, serviced lots ready for construction). The absorption rate metric applies to both but means different things in each context.
Finished lot absorption rate measures the pace at which ready-to-build lots sell to builders or end buyers. This is the metric most relevant for builders who are buying finished product. It tells them how quickly competing builders in the same market are moving and whether their planned sales pace is supported by the market's demonstrated demand.
Raw land absorption rate is slower and more volatile. Because raw land transactions are fewer, larger, and driven by long-term development rather than near-term construction, the rate is harder to calculate consistently. A better metric for raw land is price velocity—whether per-acre prices are moving up or down in the target geography over the trailing 24 months—combined with entitlement activity as a leading indicator of future finished lot supply.
For builders using absorption rate to time raw land acquisition, the most useful signal is not the raw land absorption rate itself but the finished lot absorption rate in the same submarket. Strong finished lot absorption (lots moving quickly to construction starts) is the leading indicator that demand for new raw land will follow as finished lot inventory depletes.
Absorption Rate and Days on Market: Two Sides of the Same Signal
Absorption rate and days on market (DOM) are complementary metrics that confirm the same underlying market condition from different angles. Absorption rate tells you the percentage of inventory sold per period. Days on market tells you how long the average parcel or lot sits before a buyer commits. Both metrics move in opposite directions to confirm the same trend: a rising absorption rate typically correlates with a falling DOM, and vice versa.
When absorption falls but DOM stays stable, or when DOM rises but absorption rate holds, it usually indicates a composition change in the market: different property types or price tiers are selling at different rates, and the blended metric is masking segment-level variation. Builders in this situation need to break the analysis down to their specific lot size, price tier, and submarket geography to get a signal they can act on.
How Acres Surfaces Signals for Homebuilder Land Teams
Absorption rate analysis is only as reliable as the transaction data behind it. Acres gives homebuilder land teams and buyers access to the most extensive, complete view of land data in a single system, including parcel boundaries, ownership records, recent sales, zoning, and market velocity signals for over 150 million U.S. parcels.
Rather than pulling transaction counts from county deed records and active listings from MLS systems separately to calculate absorption rate, Acres consolidates parcel-level sales data and market velocity signals into a single platform. The calculation that takes a land analyst two weeks of data collection runs in a single Acres session.
Tip: The Acres Home Builder Index surfaces even more details for builder acquisition tracking including LLC unmasking, monthly reports on expansion activity, and market signals to spot over-saturated markets and growth corridors. Book a demo to try it today.
-Aug-13-2026-08-46-34-3410-PM.png)