Permitting timeline is now one of the key variables steering where new data center construction concentrates. A site that takes 60 days to permit draws construction capital. A site that takes 36 months does not—regardless of how well it scores on land availability, proximity to fiber, or baseline power access. The data center industry has known this abstractly for years, but the permit data from 2024 and 2025 makes it concrete.
The construction pipeline is moving away from markets where community opposition, legislative activity, and special exception requirements have lengthened approval cycles, and toward markets where streamlined permitting, utility engagement programs, and regulatory clarity are compressing the time from site control to construction start.
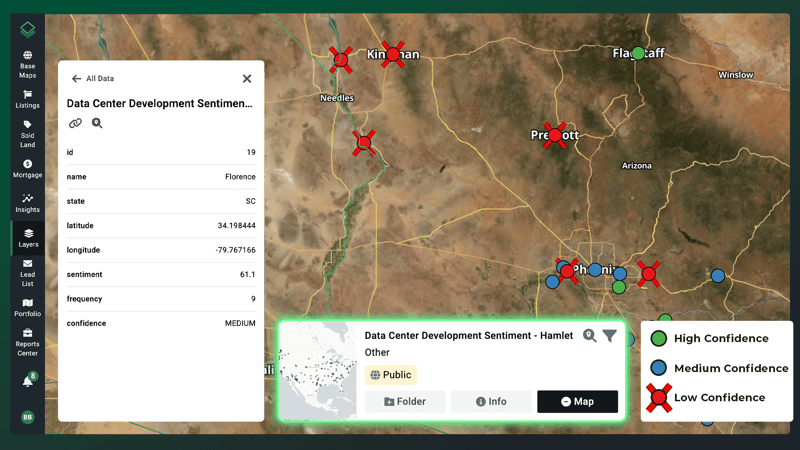
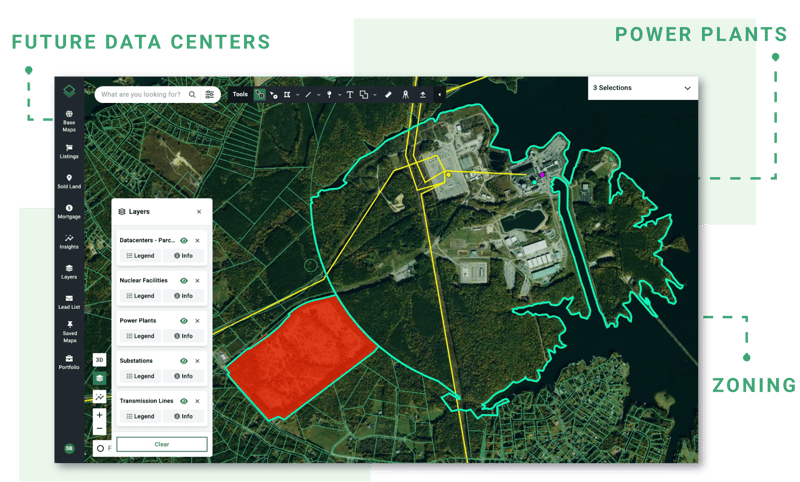
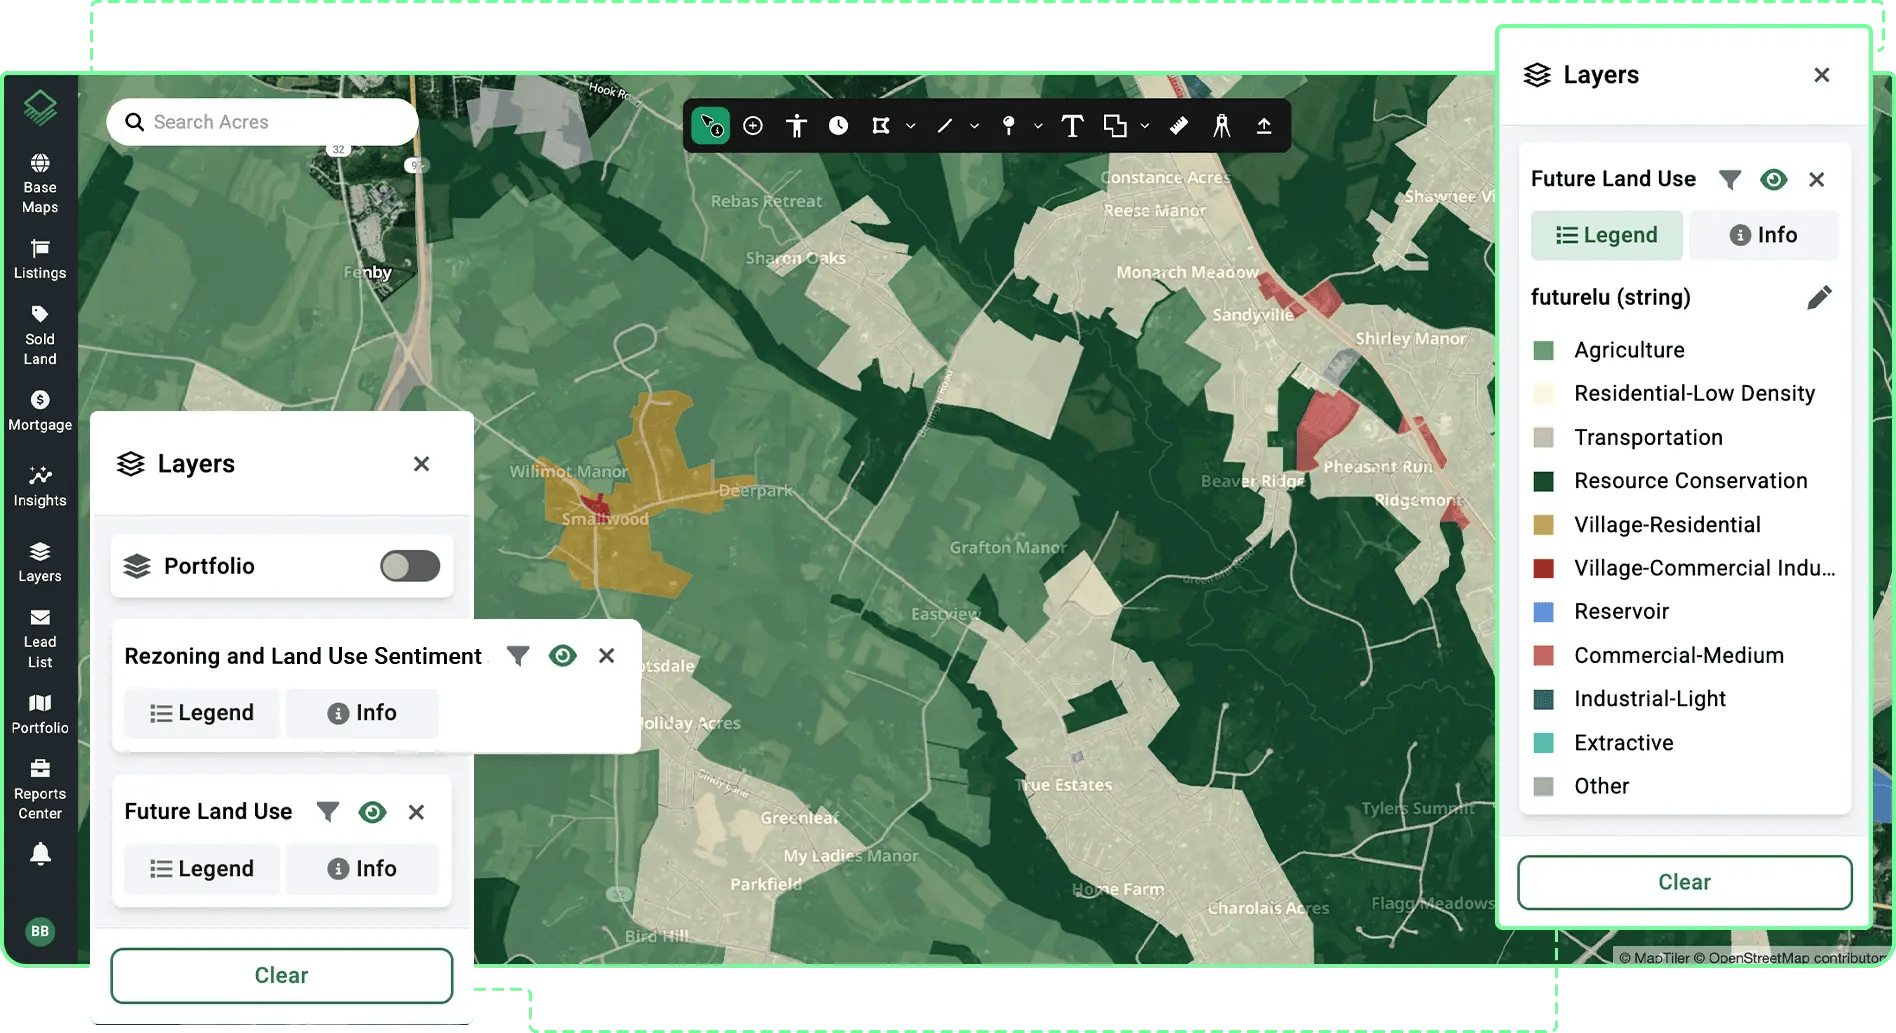
Acres.com surfaces parcel-level zoning context, future land use data, development sentiment, and infrastructure proximity signals across over 150 million U.S. parcels so data center site selection teams can evaluate the permitting environment before any engagement with local authorities begins.
Contents
Why Has Permitting Become the Variable That Steers Construction Dollars?
Which Markets Are Winning the Permitting Race in 2026?
Data Center Permitting Speed by Market - 2026 Comparison Chart
How Permitting Trajectory Differs From Current Zoning Status
How Acres Surfaces Zoning Trajectory Signals for Data Center Site Teams
Permitting Timeline Is Now a First-Order Site Selection Variable
Why Has Permitting Become the Variable That Steers Construction Dollars?
In 2025, lawmakers across all 50 states introduced 238 data center bills. More than 40 were enacted in 21 states. Permitting timelines in legacy markets have stretched from 6 to 12 months to 2 to 3 years, and in some jurisdictions they are longer. The 238 bills created a patchwork of energy, water, and zoning requirements that vary by state and by county, meaning that the permitting environment in a target market is a primary underwriting variable.
Large concentrations of data center demand in the same grid regions like Northern Virginia, Phoenix, Silicon Valley, produced rising electricity prices, increasing pressure on local infrastructure, and a political response from communities that had not anticipated the scale of development. That response has moved from neighborhood opposition to legislative action, and legislative action produces durable changes to permitting timelines that capital reallocates around.
Local resistance or permitting delays stalled a quarter of planned U.S. data center builds in 2025. That is not a rounding error in the construction pipeline - it represents tens of billions of dollars in capital that was redirected, delayed, or abandoned because permitting risk was not adequately priced into the site selection decision.
The developers and site teams that recognized the permitting trajectory earlier in the cycle are the ones that avoided those project stalls. Reading the trajectory requires monitoring planning commission agendas, legislative activity, and community organizing, not just reviewing the current zoning map.
Which Markets Are Winning the Permitting Race in 2026?
The permit data from 2022 through mid-2026 shows a clear geographic reallocation of construction activity that directly tracks permitting speed and regulatory posture. Northern Virginia, which has dominated the data center market for two decades, has seen a measurable deceleration in new construction as Loudoun County's special exception approval process has added four to eight months to every new project's timeline.
An estimated $3 to $5 billion in data center construction that would have been permitted in Virginia in 2025 to 2026 has instead been redirected to Texas, Ohio, Indiana, and Georgia—states where permitting is frequently faster and community opposition is less organized. Texas benefits from minimal zoning restrictions, expedited building permit review, and a political environment that actively welcomes data center development. The DFW and San Antonio markets have become among the fastest from concept to construction start.
Data Center Permitting Speed by Market - 2026 Comparison Chart
| Market |
Permitting Timeline |
Trend |
Construction Pipeline Status |
| Loudoun County, VA |
6-12 months (was 60-90 days) |
Lengthening
|
Decelerating; investment redirecting |
| Dallas-Fort Worth, TX |
30-60 days |
Stable/favorable |
Accelerating; top receiving market |
| Columbus/Central OH |
60-120 days |
Stable |
Growing; Meta, Google, AWS active |
| Atlanta, GA |
60-90 days |
Stable |
Strong; Southeast corridor anchor |
| Indiana (LEAP District) |
Utility partnership streamlined |
Improving |
Accelerating; gigawatt-scale commitments |
| Phoenix, AZ |
3-6 months |
Tightening |
Moderating; power constraints reinforcing |
| Cedar Rapids, IA |
Expedited by jurisdiction |
Fast-track |
Emerged rapidly; 7 permits, $3B+ value |
| New York (statewide) |
Moratorium proposed (2026) |
Restrictive |
Paused; 20MW+ facilities affected |
| Chicago, IL |
6-12+ months (gated by queue demand) |
Utility constrained |
Activity declining from prior peak |
Note: Data reflects market estimates, trends, and current policy signals as of 2026. Specific permitting timelines, utility grid queues, and regulatory conditions vary by municipality and project scope.
Virginia recorded permits for 67 data center projects since 2022, nearly three times the next closest state. But the more important shift is where new growth is beginning to surface. Illinois permit activity peaked in 2024 and has declined since. Cedar Rapids, Iowa jumped from zero to seven permits and more than $3 billion in declared project value in under two years—a pattern driven directly by jurisdictional decisions to expedite approvals and pre-clear land use for data center development.
The Cedar Rapids pattern illustrates how fast permitting posture can redirect construction capital. A jurisdiction that makes a deliberate decision to streamline approvals, coordinate with utilities, and create a predictable regulatory pathway can attract multi-billion-dollar project commitments in a two-year window. The capital is looking for viable sites and the regulatory environment determines which jurisdictions have them.
|
The Acres Data Center Index tracks hyperscale land acquisitions, entity unmasking, and verified data center transactions nationwide. For site selection teams evaluating permitting trajectories alongside land availability and infrastructure proximity, the Data Center Index surfaces early-stage acquisition activity and parcel-level zoning context so you can identify emerging markets and evaluate regulatory environments before public announcements or engagement with local authorities.
|
How Permitting Trajectory Differs From Current Zoning Status
Current zoning status and permitting trajectory are separate variables. A jurisdiction that permits data centers by-right today may have active legislative proposals that will require special exception approval within 12 months. A jurisdiction that has historically been difficult may have passed streamlining ordinances that make it faster than its reputation suggests.
For developers and investors, understanding the process means underwriting permitting timelines as a real financial variable—accounting for jurisdictional history, local posture, and developer track record—rather than treating them as a fixed assumption.
As several mature U.S. markets add steps, other jurisdictions are streamlining, creating opportunities in markets that were previously considered secondary or tertiary for data center development.
Reading permitting trajectory requires monitoring planning commission agendas, legislative session activity, utility engagement announcements, and economic development program signals, not just reviewing the current county zoning map. Jurisdictions that are moving toward streamlined review, creating data center overlay zones, or establishing utility partnership programs are showing favorable trajectory even if their current permit database does not yet reflect elevated activity.
The 176 data centers permitted in the U.S. in 2025 were the most in a single year on record. If all of them came online, their combined power draw would exceed every U.S. state's consumption except Texas. That scale of demand, concentrated in the same grid regions where power prices are already rising, was always going to produce a political response, and that political response is now visibly shaping where the next wave of 176 permits will go.
Rather than assembling permit data from each county portal, monitoring legislative activity across 50 state sessions, and tracking zoning changes in target markets separately, Acres integrates parcel-level zoning context, community and civic sentiment data, and infrastructure proximity signals so site selection teams can evaluate the permitting environment alongside the physical and power-related variables in a single research workflow.
How Acres Surfaces Zoning Trajectory Signals for Data Center Site Teams
Permitting trajectory is a parcel-level signal that requires seeing current zoning status, recent transaction patterns, and infrastructure context in the same geography at the same time. Acres gives data center development teams access to the most extensive, complete view of land data in a single system. See a complete, connected view of ownership, risk, and opportunity, instantly. Explore zoning and permitting context on Acres.
Weeks of land research become minutes with complete land data and powerful AI. For site selection teams tracking construction pipeline geography and evaluating candidate markets by permitting posture alongside infrastructure availability, parcel-level zoning and transaction data on Acres surfaces the context that makes permitting trajectory analysis actionable rather than theoretical.
Permitting Timeline Is Now a First-Order Site Selection Variable
The geographic reallocation of data center construction capital in 2025 and 2026 is the clearest evidence that permitting timeline has become a primary site selection variable, not a secondary one. Markets where special exception requirements, community opposition, and legislative activity have lengthened approval cycles are losing construction pipeline to markets where streamlined permitting, utility coordination, and regulatory clarity compress the timeline from site control to construction start.
Site selection teams that evaluate permitting trajectory alongside infrastructure proximity and power access are the ones building project pipelines that do not stall after capital is committed to land control. That requires parcel-level zoning data, current transaction records, and regulatory monitoring across wide geographies, all in a single research workflow.
Ready to evaluate permitting trajectory and zoning context for data center candidate markets? Surface parcel-level zoning, sentiment data, and infrastructure maps for any U.S. geography on Acres. Start your data center permitting analysis on Acres.
-3.png)