The Acres land value signal stack is a four-signal framework for evaluating land investment potential before formal due diligence begins. The four signals are Price Velocity (the rate at which comparable parcel values are moving in a target geography), Infrastructure Proximity (the distance and connectivity to transmission infrastructure, fiber routes, and water supply), Zoning Trajectory (the direction of regulatory change in the jurisdiction), and Absorption Rate (the pace at which comparable parcels are being acquired and developed in the market).
Applied to data center site selection, the signal stack surfaces which parcels are genuinely positioned for development and which are priced on aspiration rather than infrastructure reality.
In a market where power availability determines project viability and site competition is compressing decision windows, the signal stack gives development teams a structured, data-backed way to rank candidate sites before utility engagement begins.
Acres.com surfaces all four signals at the parcel level for over 150 million parcels nationwide, turning a multi-week screen into a same-session analysis.
Contents
Why Standard Comparable Sales Analysis Falls Short in Data Center Site Selection
What Is Price Velocity and Why Does It Matter for Data Center Site Selection?
Infrastructure Proximity: Reading the Signal That Determines Power Viability
Zoning Trajectory: Why Current Zoning Is Not the Full Story
Absorption Rate: Reading Market Conviction from Transaction Velocity
What Does the Signal Stack Tell You That Comparable Sales Cannot?
How Acres Surfaces the Signal Stack for Data Center Site Teams
Why Standard Comparable Sales Analysis Falls Short in Data Center Site Selection
The average monthly asking rate for large-scale data center requirements increased 12.6% year-over-year in 2024, with further gains in 2025 as power-constrained primary markets continued to compress available inventory. Data center construction under way in primary markets reached a record 6,350 MW at year-end 2024, more than double the prior year's pipeline.
Q3 2025 saw 7.4 gigawatts of U.S. data center capacity leased—more than the total leased across all of 2024. That volume of absorption is compressing the time between site identification and site decision to a fraction of what traditional real estate cycles allowed.
Data center site selection criteria that rely primarily on comparable sales analysis produce answers that are already stale. Comparable sales tell you where the market was. The signal stack tells you where it is going, specifically for parcels in the infrastructure corridor that data center development requires.
What Is Price Velocity and Why Does It Matter for Data Center Site Selection?
Price velocity measures the rate of value movement for comparable parcels in a target geography over a trailing period (typically 12 to 24 months). A parcel in a market with accelerating price velocity is positioned in the path of capital. Developers are already transacting nearby, and the signal indicates that land values are repricing upward ahead of announced development activity.
For data center site selection, price velocity is a leading indicator of infrastructure confirmation. When parcels near a specific substation or transmission corridor begin transacting at accelerating rates, it typically means that one or more development teams have already confirmed power availability in that corridor and are locking up land ahead of public announcement. A development team that reads the price velocity signal early can identify these corridors before they become competitive, which is the window where optionality and pricing flexibility exist.
Price velocity analysis requires granular, current transaction data at the parcel level. County deed records are the source, but they are filed on inconsistent schedules and require normalization across jurisdictions to be usable for systematic comparison. Acres aggregates this data for millions of U.S. parcels, making price velocity analysis across multi-state geographies a research task rather than a data compilation project.
Infrastructure Proximity: Reading the Signal That Determines Power Viability
Infrastructure proximity is the most technically determinative of the four signals for data center applications. It measures a parcel's proximity to high-voltage transmission infrastructure, substations, fiber routes, and water supply, the four physical inputs that define whether a site can support data center operations.
The key insight is that infrastructure proximity is not binary. Distance to a substation matters less than the substation's available capacity and interconnection queue status. A parcel two miles from a fully committed substation has less practical infrastructure proximity than a parcel five miles from a substation with active available load. The signal is not just about physical distance, but the infrastructure's current and near-term availability for new large loads.
With Acres:
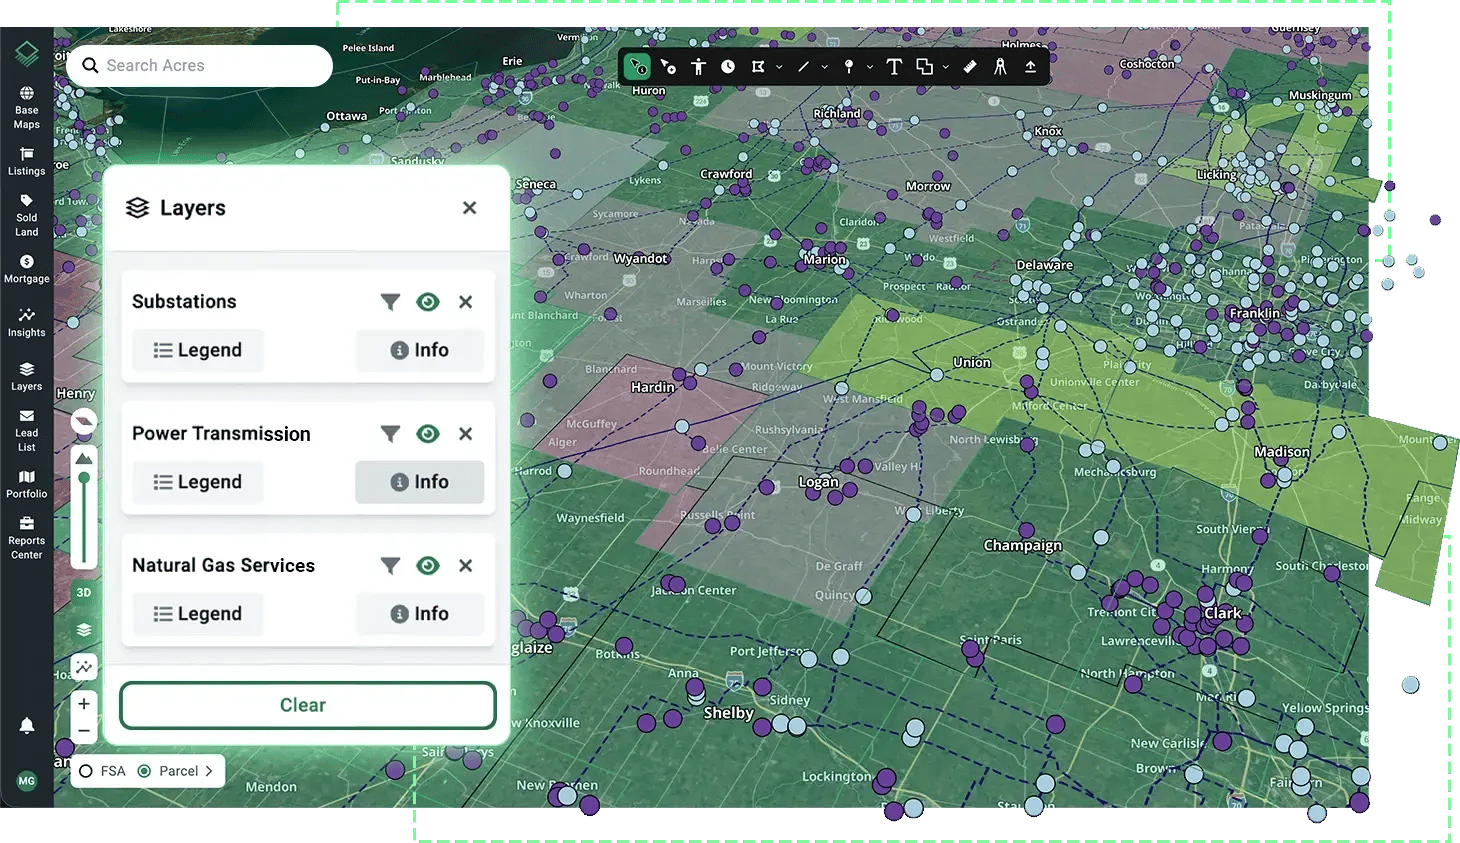
Acres surfaces infrastructure proximity signals like substation adjacency, utility corridor presence, and fiber route proximity, alongside parcel boundaries, zoning, and ownership data in a single map view. For data center site selection teams screening secondary and tertiary markets, this enables an infrastructure-first parcel screen before formal utility engagement begins.
Zoning Trajectory: Why Current Zoning Is Not the Full Story
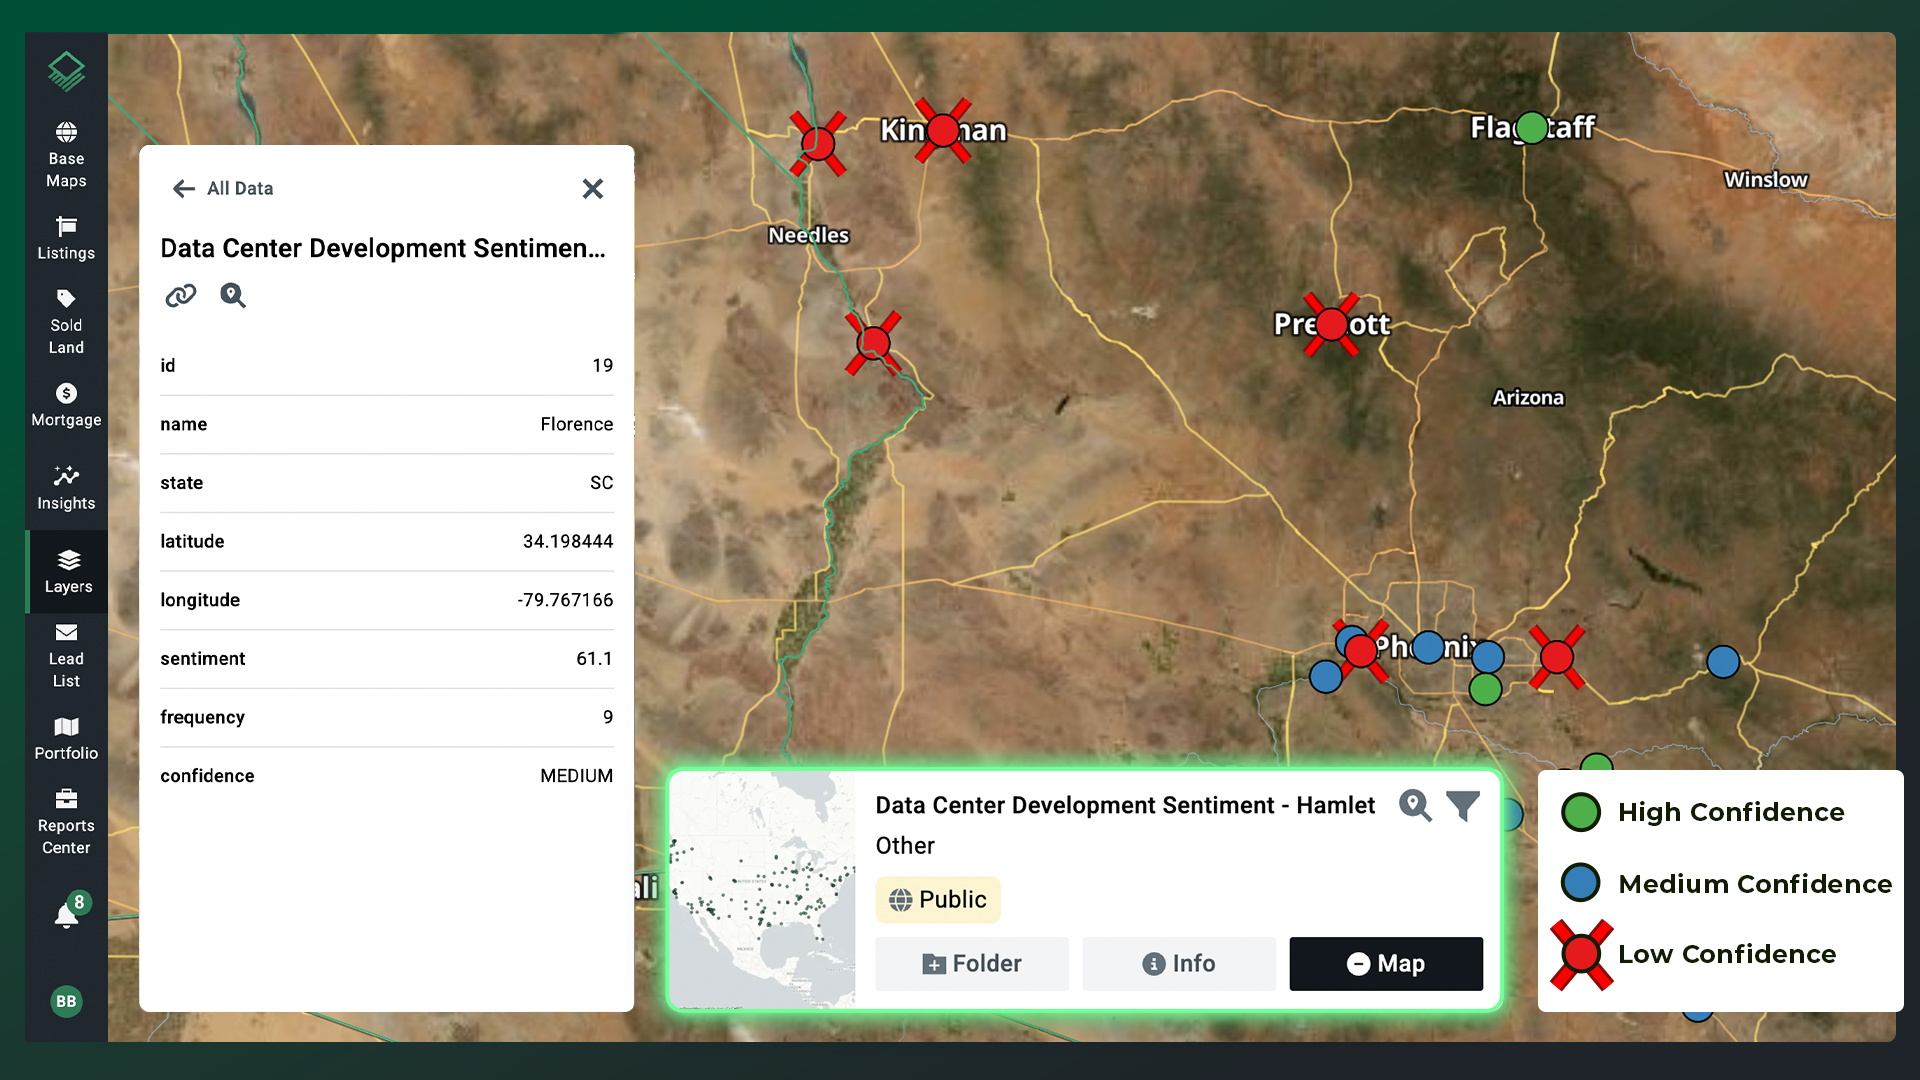
Zoning trajectory measures the direction of regulatory change in a jurisdiction, whether the zoning environment is becoming more or less favorable for data center development over time. Current zoning is a static indicator. Zoning trajectory is dynamic and predictive.
A jurisdiction that permits data centers today but has active legislative opposition (pending moratorium bills, community mobilization, or county-level use restrictions) carries a different risk profile than one with stable, data-center-friendly industrial zoning and no active opposition.
Equally, a jurisdiction that does not currently permit data centers by right may have an active economic development program courting digital infrastructure investment may be moving toward a more favorable posture.
Reading zoning trajectory requires tracking regulatory filings, planning commission agendas, and legislative activity, not just the current county zoning map. The signal stack approach flags zoning trajectory as a distinct factor precisely because current zoning and future zoning risk are separate variables that both affect a site's development viability.
Absorption Rate: Reading Market Conviction from Transaction Velocity
Absorption rate measures how quickly comparable parcels in a target geography are being transacted. A high absorption rate signals market conviction: multiple buyers are competing for similar sites, which indicates that at least some of those buyers have confirmed the infrastructure conditions that make those sites viable.
For data center site selection, absorption rate is a proxy for infrastructure confirmation density. When a specific submarket shows rapid parcel absorption, particularly parcels in the 50- to 500-acre range with industrial or data-center-adjacent zoning, it is a strong indicator that development teams have validated power and permitting conditions in that submarket.
The absorption rate signal lets a site selection team identify these corridors based on observed transaction behavior rather than waiting for announced development activity.
Absorption rate analysis requires the same granular transaction data as price velocity, but frames it differently. Rather than measuring price movement, it measures transaction frequency. Both signals together provide a more complete picture of market momentum than either alone.
What Does the Signal Stack Tell You That Comparable Sales Cannot?
Comparable sales analysis answers one question: what did similar parcels sell for? The signal stack answers a different set of questions: where is value moving, why is it moving, and which specific parcels are positioned to benefit before the market reprices them.
In data center site selection, the signal stack's advantage is timing. Before formal due diligence begins, a development team reads the target geography's price velocity, infrastructure proximity, zoning trajectory, and absorption rate signals. By analyzing these factors early, they arrive at the utility engagement and land control phase with a pre-qualified site list rather than a broad candidate pool.
That compression of the site selection process is where the competitive advantage is built in the current market.
From weeks of research to a structured first-pass screen.
The signal stack is only as useful as the data behind it. Price velocity requires current transaction records. Infrastructure proximity requires parcel-level GIS data aligned with utility service territory maps. Zoning trajectory requires real-time regulatory monitoring. Absorption rate requires normalized transaction frequency data across geographies.
Rather than pulling each signal from a separate source, Acres integrates these data layers so development teams can run a signal stack analysis for any U.S. geography in a single session.
How Acres Surfaces the Signal Stack for Data Center Site Teams
Acres gives data center development teams access to the most extensive, complete view of land data in a single system: parcel boundaries, ownership records, zoning classifications, environmental signals, infrastructure proximity context, and transaction history for over 150 million U.S. parcels.
The four signals in the land value signal stack, Price Velocity, Infrastructure Proximity, Zoning Trajectory, and Absorption Rate, are all grounded in the parcel-level data that Acres aggregates and surfaces in a single platform. Explore land value and site analysis on Acres for any data center target market.
If your team has criteria for the infrastructure corridor, power capacity range, and zoning category they need, they can find it on Acres. Rather than piecing together transaction records, GIS layers, and regulatory data from separate sources, Acres integrates the data and signal context that make the signal stack actionable for data center site selection at scale.
Using the Signal Stack Before Formal Due Diligence
The land value signal stack gives data center site selection teams a structured framework for evaluating candidate parcels before formal due diligence resources are committed. Where power availability is the binding constraint and site competition is compressing decision windows, the signal stack provides the pre-qualification layer that makes formal diligence faster and more targeted.
The four signals are only as useful as the data behind them. Site selection teams that read the stack with current, granular, parcel-level data arrive at the due diligence phase with a shorter, better-qualified site list. That is the competitive advantage the signal stack is built to provide.
Ready to apply the signal stack to your next data center site search? Explore parcel-level price velocity, infrastructure proximity, zoning, and transaction data on Acres. Book a demo to see how your team can access these tools.
-1.png)